
To say that cosmetics brand elf Beauty (ELF) is suffering a rough year in 2026 would be underselling the pessimism. Since the beginning of January, ELF stock has dropped more than 27% of value. In the past 52 weeks, it has witnessed a more than 25% loss. On cue, the Barchart Technical Opinion indicator rates shares as a 100% Strong Sell, with key metrics pointing to a continued probability of downside momentum.
What’s the cause of the meltdown? As per usual, the narrative is a multivariate one. Perhaps the most obvious culprit is the series of disappointing quarterly results and weak forward guidance. On a fundamental level, elf remains highly exposed to China-related risks due to how its dependent supply chain. And while I don’t want to get into the weeds, legal issues have created distracting headlines, which doesn’t inspire confidence in ELF stock.
Of course, the pressing geopolitical conflict in Iran and the compounding pressures that it imposes have not exactly offered a tailwind either. Beyond global supply chain risks, the prospect of soaring energy prices could easily dampen consumer sentiment, leading either to a trade-down effect and/or curtailed spending. Needless to say, it’s not a great situation for ELF stock.
Subsequently, when the cosmetics brand releases its next earnings report on May 20, you might assume apprehension on the part of the smart money. However, a more appropriate term may be “anticipation” — anticipation of upside risk.
Volatility Skew for ELF Stock Reveals an Unusual Dynamic
While various online forums talk excitedly about the surge in implied volatility (IV) heading into a major event like an earnings disclosure, I’m in the camp that hates the uncertainty. As you can tell from my previous work, I rely on inductive reasoning to build trading ideas. That means observing patterns under specified conditions — but those patterns often go haywire (relative to expectations) during earnings season.
A meaningful solution to temper the wildness is analyzing volatility skew. By definition, the skew identifies IV across the strike price spectrum of a given options chain. It’s best to think of this indicator as an insurance market. When volatility readings for put and call options at certain strike price zones are unusually elevated, this dynamic reflects the primary concern of smart money traders — the demo that predominantly utilizes options.
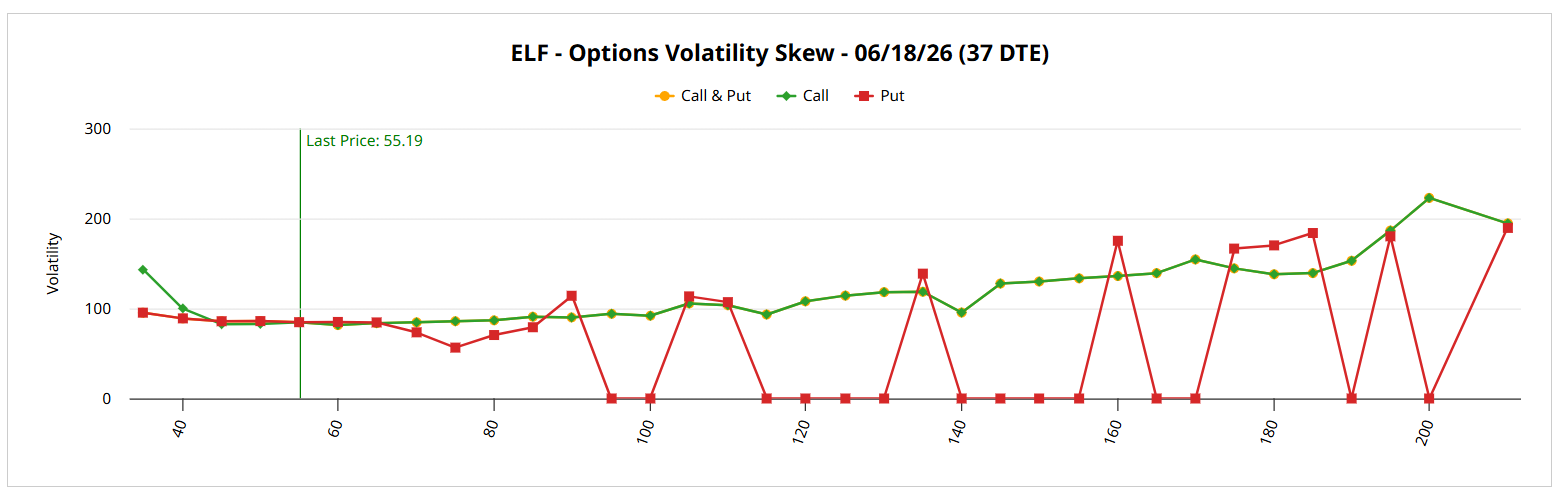
Looking at the volatility skew for the June 18 expiration date, the disjointed nature of the chart is awfully conspicuous. In many (if not most) equity markets, a “smirk” is present where put options are more expensive than calls, symbolizing downside protection demand. With ELF stock, the framework is opposite the expected behavior: call dominance represents the primary sentiment, especially further up the strike price range.
Essentially, this right-side skew suggests that smart money traders are more concerned about missing a massive, sudden recovery in ELF stock than they are about incurring further downside. That’s a mighty significant detail when you have a critical financial disclosure coming up.
Now, to be crystal clear, the smart money is sophisticated but not necessarily prescient. Just because people are paying more for auto insurance doesn’t mean that a car accident is more likely to occur. That said, there’s a good inductive reason why ELF stock deserves a closer look by bullish speculators.
Narrowing Down a Trading Idea
Using a dataset going back to January 2019, the odds of a random long position held for 10 weeks being profitable are 63.6%. Out of 365 rolling 10-week sequence, 232 sequences managed to rise above the starting point. Moreover, the observed median distribution over this period would likely see ELF stock range between $53 and $61 (assuming a starting price of $55.19).
Generally speaking, you’re looking at a decent upward bias with solid near-term return potential. However, we’re not interested in trading ELF stock at random. Instead, we want to catch ELF on a downstroke, under the theory that it would take significantly more “energy” to sustain a strong downtrend.
In the past 10 weeks, ELF printed only three up weeks, leading to an overall downward slope. Under this specific signal, the forward 10-week distribution tends to shift net positively, between $50 and $71 (assuming the same $55.19 starting price). At the halfway point, the median expected price of ELF stock would be around $63.
Since the smart money is positioned for upside convexity, it’s perhaps not out of the question for the beauty brand to deliver surprisingly positive results. Because of this speculation, I’m intrigued by the 60/65 bull call spread expiring June 18. Should ELF stock rise through the $65 strike at expiration, the maximum payout currently stands at nearly 178%.
On the date of publication, Josh Enomoto did not have (either directly or indirectly) positions in any of the securities mentioned in this article. All information and data in this article is solely for informational purposes. For more information please view the Barchart Disclosure Policy here.

/A%20corporate%20sign%20for%20SK%20Hynix%20by%20Tada%20Images%20via%20Adobe%20Stock.jpeg)

/2d%20illustration%20of%20Cloud%20computing%20by%20Blackboard%20via%20Shutterstock.jpg)
/Server%20racks%20by%20dotshock%20via%20Shutterstock.jpg)