
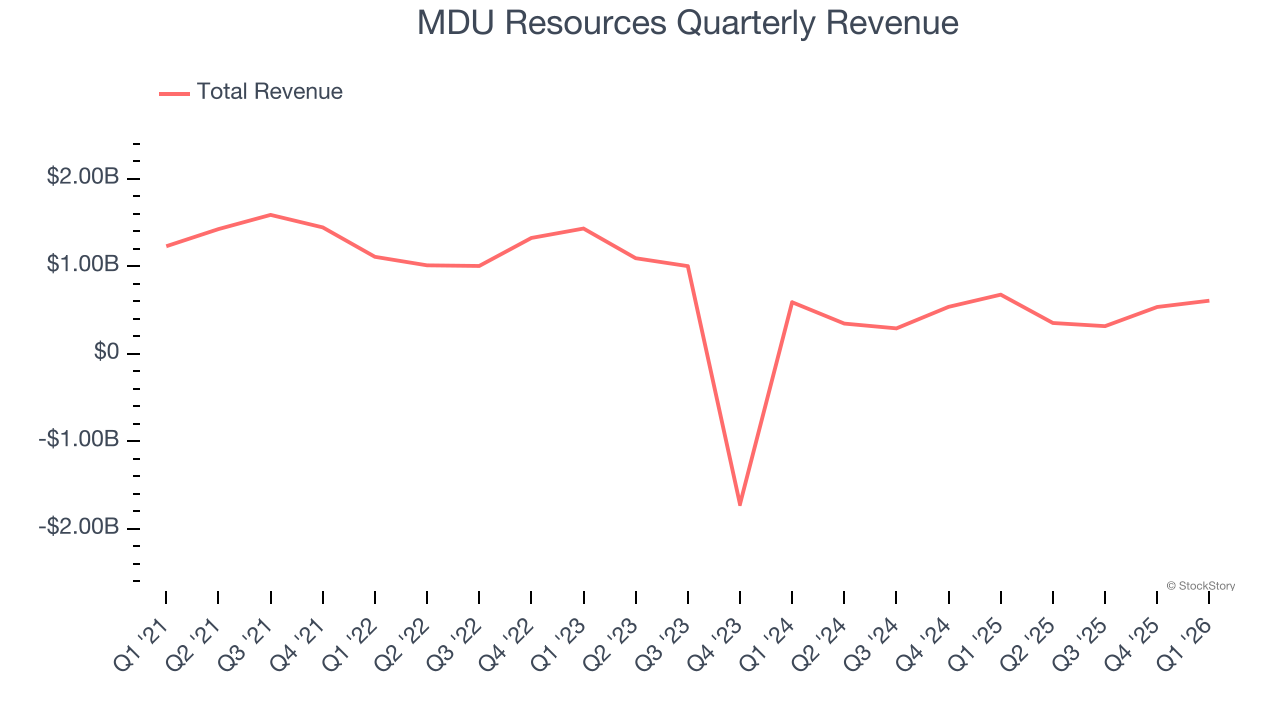
Energy and construction materials company MDU Resources (NYSE:MDU) missed Wall Street’s revenue expectations in Q1 CY2026, with sales falling 10.2% year on year to $606 million. Its GAAP profit of $0.39 per share was 9.5% below analysts’ consensus estimates.
Is now the time to buy MDU Resources? Find out by accessing our full research report, it’s free.
MDU Resources (MDU) Q1 CY2026 Highlights:
- Revenue: $606 million vs analyst estimates of $688.3 million (10.2% year-on-year decline, 12% miss)
- EPS (GAAP): $0.39 vs analyst expectations of $0.43 (9.5% miss)
- Adjusted EBITDA: $169.9 million vs analyst estimates of $177 million (28% margin, 4% miss)
- EPS (GAAP) guidance for the full year is $0.97 at the midpoint, missing analyst estimates by 2.5%
- Operating Margin: 19.1%, up from 16.9% in the same quarter last year
- Free Cash Flow Margin: 24.6%, up from 18.4% in the same quarter last year
- Market Capitalization: $4.57 billion
"We delivered a strong first quarter when accounting for the impact of warmer weather across our service territory," said Nicole A. Kivisto, president and CEO of MDU Resources.
Company Overview
Founded to provide electricity to towns in Minnesota, MDU Resources (NYSE:MDU) provides products and services in the utilities and construction materials industries.
Revenue Growth
A company’s long-term sales performance can indicate its overall quality. Any business can put up a good quarter or two, but the best consistently grow over the long haul. MDU Resources struggled to consistently generate demand over the last five years as its sales dropped at a 20.1% annual rate. This wasn’t a great result and is a sign of poor business quality.
Long-term growth is the most important, but within industrials, a half-decade historical view may miss new industry trends or demand cycles. MDU Resources’s annualized revenue growth of 37.1% over the last two years is above its five-year trend, suggesting its demand recently accelerated. 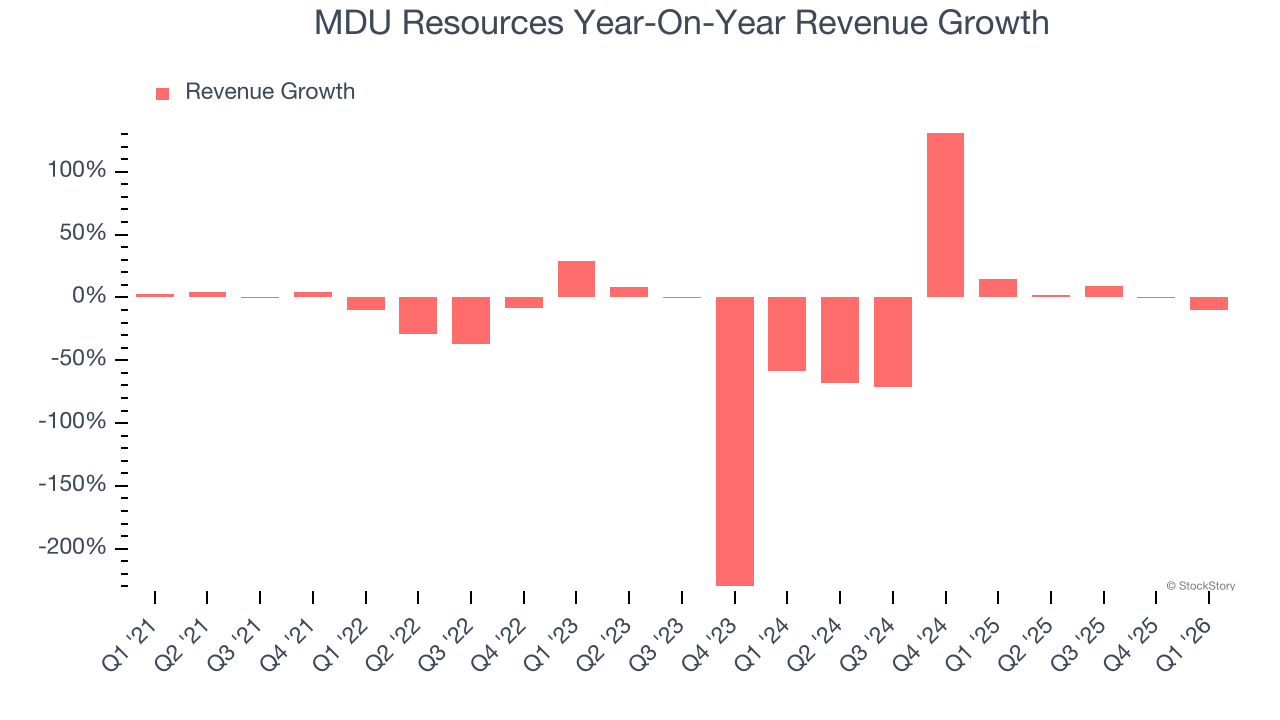
This quarter, MDU Resources missed Wall Street’s estimates and reported a rather uninspiring 10.2% year-on-year revenue decline, generating $606 million of revenue.
Looking ahead, sell-side analysts expect revenue to grow 8.1% over the next 12 months, a deceleration versus the last two years. Still, this projection is above average for the sector and suggests the market is forecasting some success for its newer products and services.
ALSO WORTH WATCHING: Nvidia’s Quiet Partner. Nvidia’s chips cost a hundred grand. The connectors that make them work cost even more. One company makes them all.
Every AI server needs specialized infrastructure the chip companies don’t make. High-speed cables. Power connectors. Thermal sensors. This 90-year-old company built a monopoly on it. The AI boom just started. This stock is still flying under the radar. Claim The Stock Ticker Here for FREE.
Operating Margin
Operating margin is an important measure of profitability as it shows the portion of revenue left after accounting for all core expenses – everything from the cost of goods sold to advertising and wages. It’s also useful for comparing profitability across companies with different levels of debt and tax rates because it excludes interest and taxes.
MDU Resources has managed its cost base well over the last five years. It demonstrated solid profitability for an industrials business, producing an average operating margin of 11.6%. This result was particularly impressive because of its low gross margin, which is mostly a factor of what it sells and takes huge shifts to move meaningfully. Companies have more control over their operating margins, and it’s a show of well-managed operations if they’re high when gross margins are low.
Looking at the trend in its profitability, MDU Resources’s operating margin rose by 6.1 percentage points over the last five years, showing its efficiency has meaningfully improved.
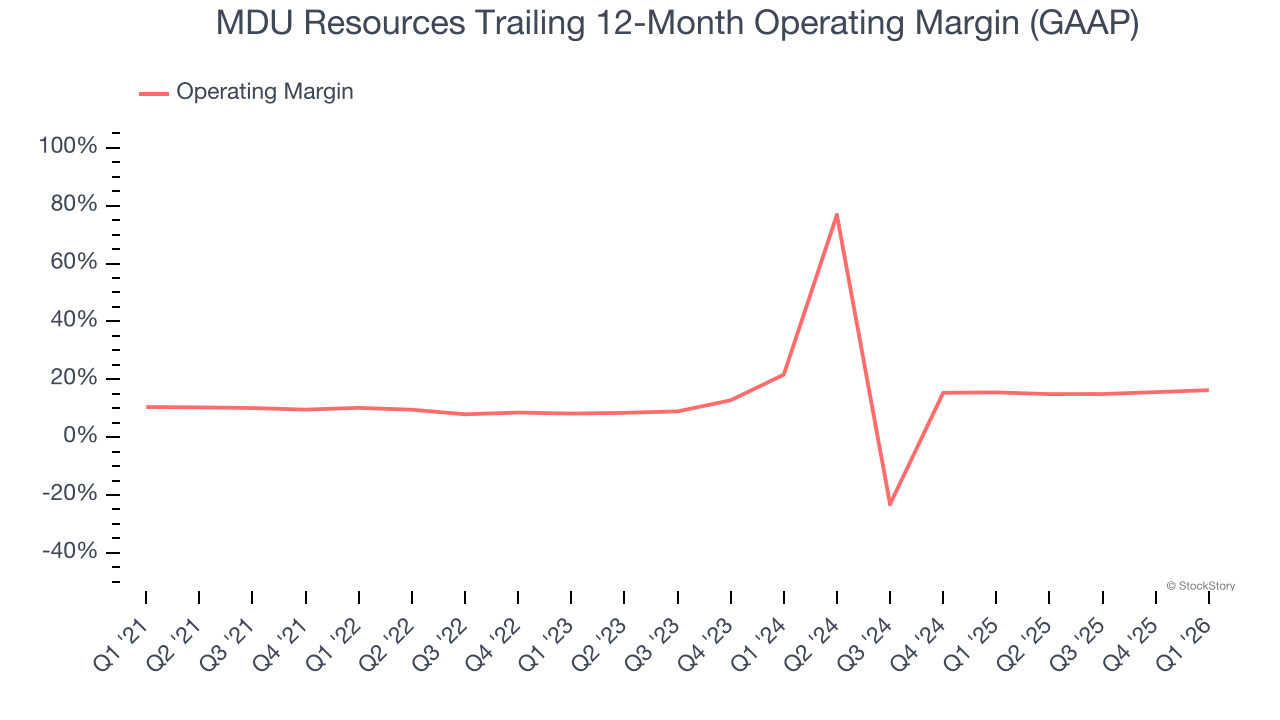
This quarter, MDU Resources generated an operating margin profit margin of 19.1%, up 2.2 percentage points year on year. Since its gross margin expanded more than its operating margin, we can infer that leverage on its cost of sales was the primary driver behind the recently higher efficiency.
Earnings Per Share
We track the long-term change in earnings per share (EPS) for the same reason as long-term revenue growth. Compared to revenue, however, EPS highlights whether a company’s growth is profitable.
MDU Resources’s full-year EPS dropped 74.7%, or 15% annually, over the last four years. We tend to steer our readers away from companies with falling revenue and EPS, where diminishing earnings could imply changing secular trends and preferences. If the tide turns unexpectedly, MDU Resources’s low margin of safety could leave its stock price susceptible to large downswings.
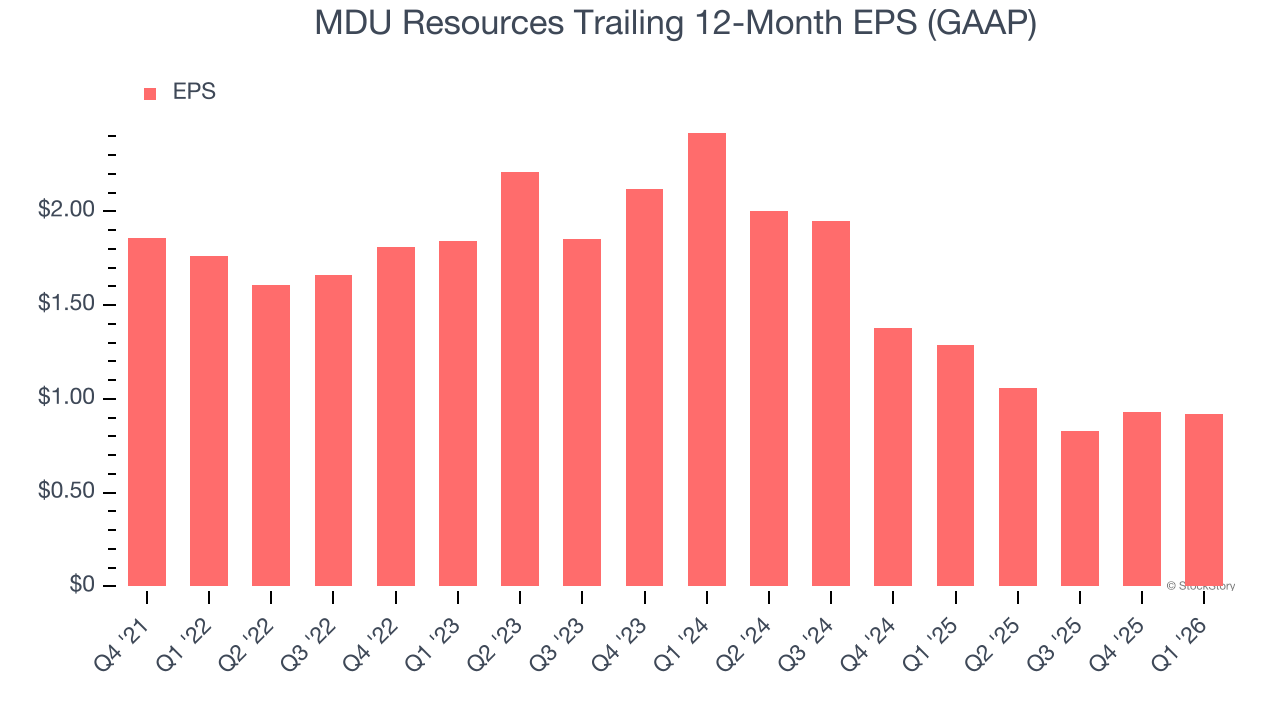
Like with revenue, we analyze EPS over a more recent period because it can provide insight into an emerging theme or development for the business.
Sadly for MDU Resources, its EPS declined by 38.3% annually over the last two years while its revenue grew by 37.1%. This tells us the company became less profitable on a per-share basis as it expanded.
We can take a deeper look into MDU Resources’s earnings to better understand the drivers of its performance. A two-year view shows MDU Resources has diluted its shareholders, growing its share count by 1.4%. This dilution overshadowed its increased operational efficiency and has led to lower per share earnings. 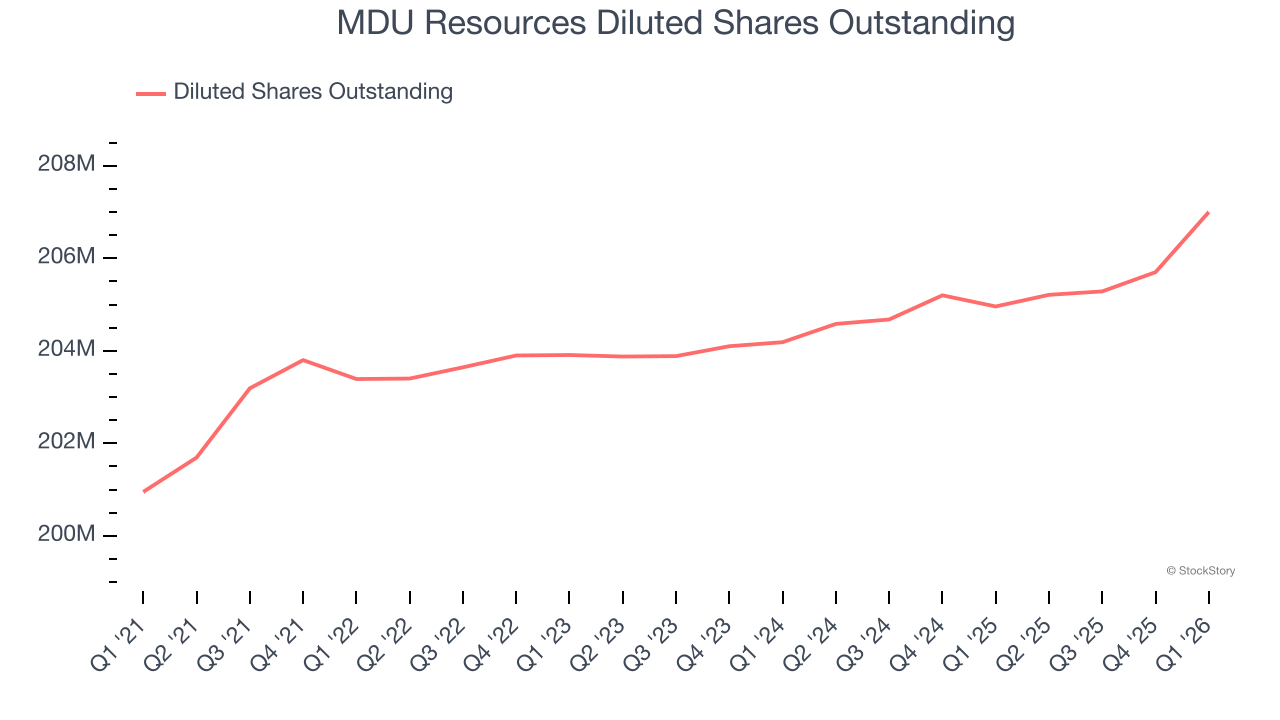
In Q1, MDU Resources reported EPS of $0.39, down from $0.40 in the same quarter last year. This print missed analysts’ estimates. Over the next 12 months, Wall Street expects MDU Resources’s full-year EPS of $0.92 to grow 11.9%.
Key Takeaways from MDU Resources’s Q1 Results
We struggled to find many positives in these results. Its revenue missed and its adjusted operating income fell short of Wall Street’s estimates. Overall, this was a weaker quarter. The stock traded down 8.8% to $20.34 immediately following the results.
MDU Resources underperformed this quarter, but does that create an opportunity to invest right now? If you’re making that decision, you should consider the bigger picture of valuation, business qualities, as well as the latest earnings. We cover that in our actionable full research report which you can read here (it’s free).
/A%20corporate%20sign%20for%20SK%20Hynix%20by%20Tada%20Images%20via%20Adobe%20Stock.jpeg)

/Netflix%20open%20on%20tablet%20by%20rswebsols%20via%20Pixabay.jpg)
