/A%20concept%20image%20of%20space_%20Image%20by%20Canities%20via%20Shutterstock_.jpg)
Rocket Lab (RKLB) represented one of the most actively traded securities though not for good reasons. On Monday, RKLB stock found itself down more than 7%, which appears to be a victim of misguided expectations. Essentially, Congress scrapped NASA’s Mars Sample Return program, which effectively removes a potential revenue stream for Rocket Lab. That said, this isn’t exactly breaking news so the volatility could be tied to general anxieties.
Still, based on the wealth of first-order analytics, it does seem to me that the red ink represents a clash between the public consensus and the smart money sentiment. Not only that, the quantitative picture suggests that RKLB stock can reflexively pop higher, thus making the contrarian position enticing.
First, options flow — which focuses on big block transactions — indicates that broader sentiment among institutional investors appears to be positive. When viewed from a cumulative perspective, January’s flow stood overwhelmingly above parity, pushing the delta imbalance to the positive side of the ledger.
Second, volatility skew — a screener that identifies implied volatility (IV) or a stock’s potential kinetic output across the strike price spectrum of a given options chain — reveals nuanced exposure to RKLB stock. Specifically, the skew for the March 20 expiration date features put-side IV elevated at the lower boundaries, while call IV pricing is elevated at the upper end.
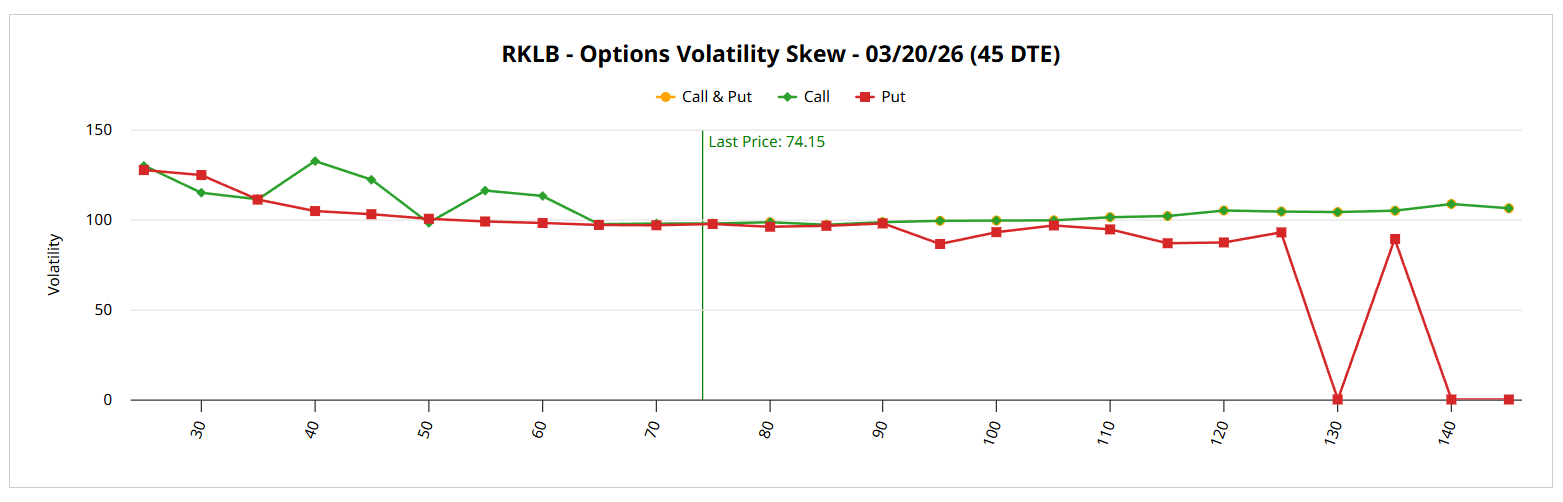
Colloquially, this setup suggests that smart money traders are buying insurance to protect against downside tail risk while maintaining hedged upside optionality. In other words, the most sophisticated market participants recognize that there’s a non-trivial possibility of RKLB stock continuing to incur sharp downswings. At the same time, this risk isn’t enough to avoid the security altogether.
In fact, the skew seemingly suggests that the smart money believes in the potential of RKLB stock eventually rising higher. That’s because on the right side of the skew, we can clearly see upside convexity being kept alive — not written off.
Drilling into a Second-Order Analysis to Speculate on RKLB Stock
Although we now have an understanding of the general sentiment of the smart money, we’re still at a loss as to where RKLB stock may actually touch ground. To get a parametric view of the prospective landscape, we can turn to the Black-Scholes-derived Expected Move calculator. For the March 20 expiration date, the model projects a range between $56.73 and $91.58. This range represents a high-low spread of 23.5% relative to the current spot price.
Where does this dispersion come from? Black-Scholes assumes a world where stock market returns are lognormally distributed. Under this framework, the estimated envelope represents where RKLB stock may symmetrically fall one standard deviation from spot (while accounting for volatility and days to expiration). Essentially, the model is saying that in 68% of cases, we would expect RKLB to land between roughly $57 and $92 when March 20 rolls around.
Mathematically, that’s a very reasonable assumption because it would take an extraordinary catalyst to push Rocket Lab stock beyond one standard deviation. That said, as debit-side traders, it’s difficult to always cover the entire spectrum of the dispersion, which would amount to an absolute spread of over 61% ($91.58 divided by $56.73).
Effectively, the challenge that we face is that we have exhausted all first-order metrics; that is, the data that Wall Street provides has largely been fully prosecuted. To extract further insights, we need to conduct a second-order analysis, which involves conditioning data on structure.
While Black-Scholes is a useful benchmark, it cannot be helped that the underlying math is calculated independent of structure. However, the equities market very much operates as a Markov property, where the future state of a system depends largely on the current state. In other words, the current context of the market could influence future valuations.
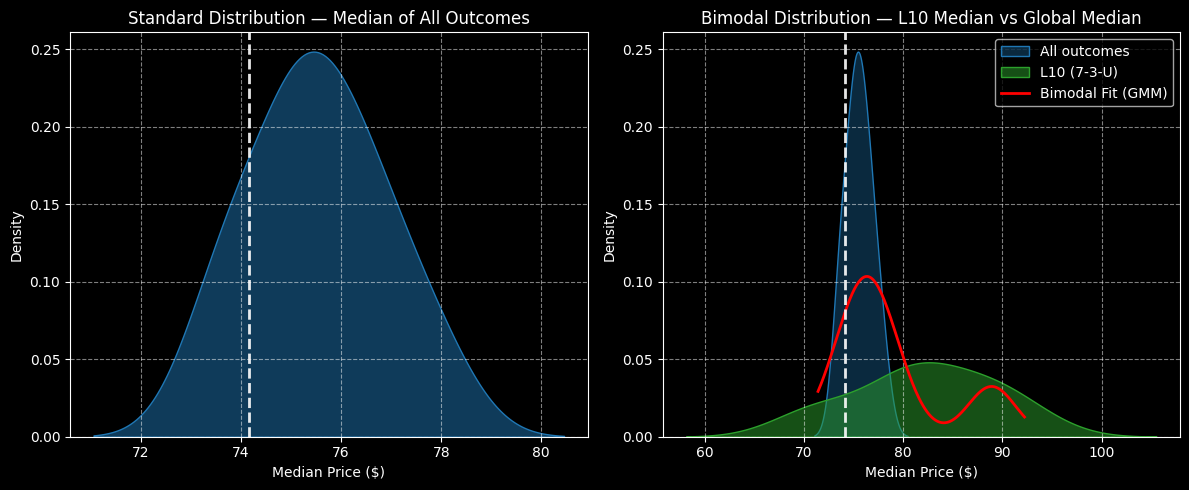
And what is the context of RKLB stock? In the past 10 weeks ending Friday, the security printed seven up weeks, leading to an overall upward slope. Under this 7-3-U condition, a combination of enumerative induction and Bayesian-lite inference would likely project RKLB landing between $64 and $100 over the next 10 weeks, which is admittedly a super-wide dispersion.
However, peak probability density would likely materialize between $80 and $85, giving us a much narrower target to aim for.
Anticipating a Probabilistic Jump
Please note that the Markovian inductive framework above features a range that’s not egregiously different than the range that Black-Scholes has calculated. What I’m trying to do with my model is not to disrupt the assessment; again, both my model and Black-Scholes agree that RKLB stock should generally trade around one standard deviation from spot. My contribution is a refinement of the data.
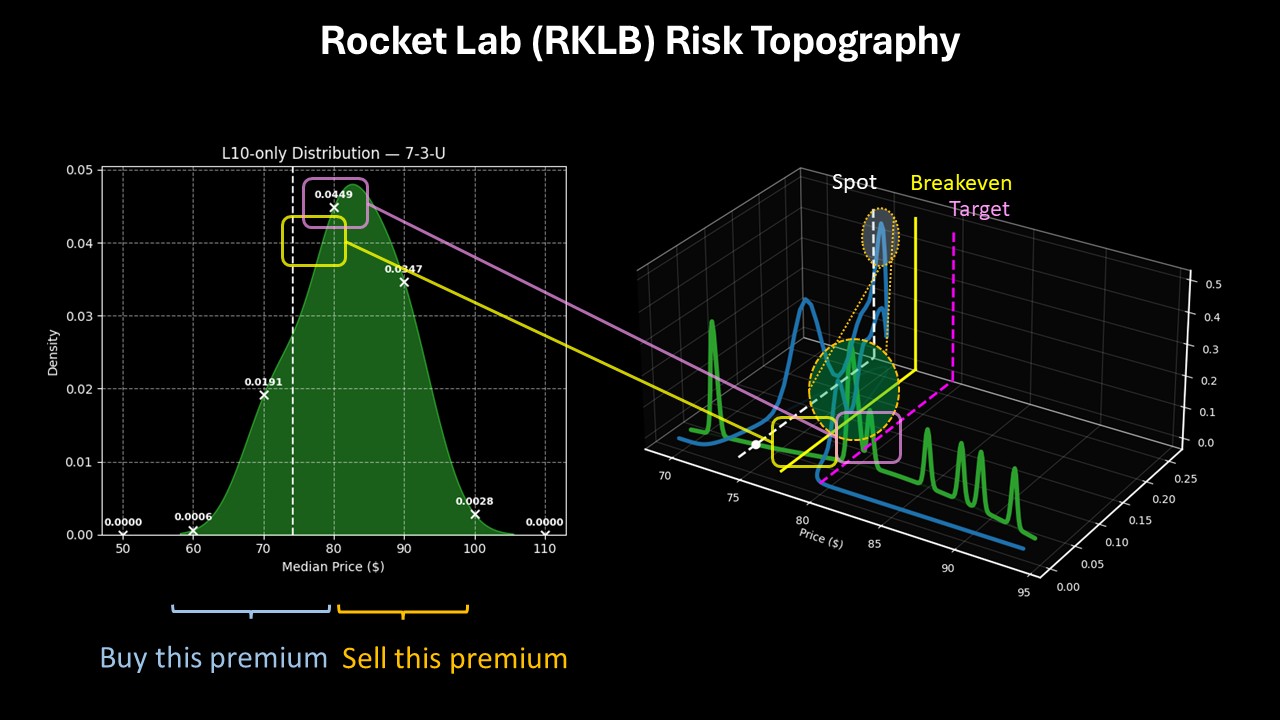
Wall Street is giving you a probabilistic surface area that covers over 61% of market breadth. I’m giving you a high-density range that’s about 6% to 7%. To be clear, I don’t claim prescience because the security could move against the model’s expected pathway. However, if RKLB stock trades according to how prior market cycles responded to the 7-3-U sequence, then the $80 to $85 target is a range to seriously consider.
Subsequently, I’m enticed by the idea of the 75/80 bull call spread expiring March 20. This trade requires RKLB stock to rise through the $80 strike at expiration, which I believe is a very reasonable target given the inductive data. Should that strike be triggered, the maximum payout would be over 122%.
On the date of publication, Josh Enomoto did not have (either directly or indirectly) positions in any of the securities mentioned in this article. All information and data in this article is solely for informational purposes. For more information please view the Barchart Disclosure Policy here.
/Micron%20Technology%20Inc_%20logo%20on%20building-by%20vzphotos%20vis%20iStock.jpg)


