The information and opinions expressed below are based on my analysis of price behavior and chart activity
Sign Up to receive Walsh Trading’s 1st Half of 2026 Market Outlook First Half of 2026 Outlook for the Livestock and Grain markets.
Monday, April 13, 2026
July Soybean Oil (Daily)
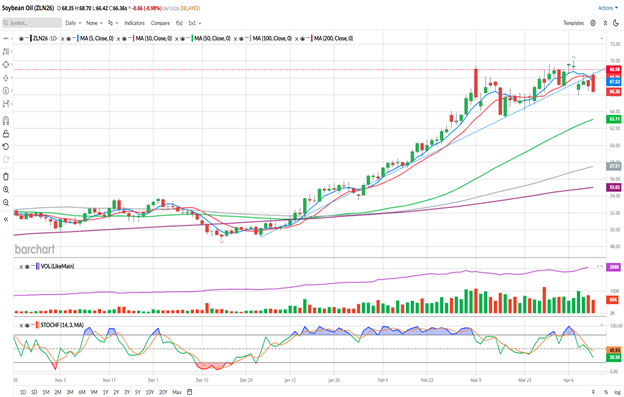
To start off the week, today July Bean Oil settled at 66.36, down 0.66 on the day. It wasn’t a huge move, by an up/down point of view. However, the market posted a large bearish engulfment on the chart with today’s trade, which I don’t think is very friendly toward prices.
Last week saw July Bean Oil post a new contract high on Tuesday. Both Monday and Tuesday last week saw strength in prices, although the market was unable to extend higher and both of those days were very close to being “Doji’s” or “Spinning Tops” on the candlestick charts that I watch. Wednesday’s trade saw a large gap down, which still has not been filled in. You may notice the red horizontal line on the chart above, denoting that gap level at 68.98. You may also notice the blue trendline that I’ve drawn on the charts, from roughly the January-March lows. The last three sessions of last week, and the one we’ve had to start the week, have all closed below that trendline.
Today’s trade saw a higher open on Sunday evening at 68.35, but by the end of the day, prices have sagged to 66.36, nearly 2.00 lower than the open and 2.34 off of the high of the day. That is, by definition I think, a large “bearish engulfment” and is not usually a positive sign for prices. Today’s settlement is the lowest since March 25th.
You may notice that the 5- and 10-day moving averages (blue/red) have made a bearish crossover with today’s trade. Both of those averages are above the market now, offering potential resistance levels at 67.53 and 68.06, respectively. Stochastics (bottom sub-graph) turned out of overbought last week and are currently pointed toward oversold. They’re not there yet, and a quick glance over this chart, seems to show a market that has preferred being overbought to oversold over the past 6 months, or so.
The bearish engulfment, added to the bearish trendline break and the moving average crossover are 3 factors that have me leaning toward the bearish side.
I do understand that Bean Oil is connected or correlated to Crude Oil prices. While that correlation has declined a bit over the past 30 days to an 89% reading, it has been averaging about a 92% correlation going back over the past 180 days. This market will be responsive to any developments that come out of the US/Iran conflict. For what it’s worth, Crude Oil at the moment, while still in positive territory, is trading about $8.00 off of the highs and the 5/10 day moving averages in May/June futures are making a bearish cross today, as well. The war news seems to be conflicting depending on who/what is your choice of source. Unfortunately, the price activity seems to be the best barometer for news, right now. And to my eye, the price activity is getting a bit bearish.
Please keep reading on for the weekly chart analysis and potential new trade signals!
July Soybean Oil (Weekly)
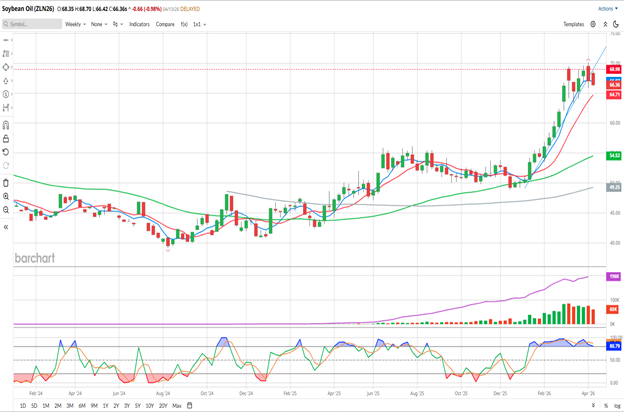
Do you recall the bearish engulfment that I mentioned above? Well, the weekly July Soybean Oil chart posted a bearish engulfment with last week’s trade. New contract highs couldn’t draw the bulls higher and prices ended last week down 1.72. The weekly open was higher than the previous week’s close and the close on Friday was under the previous week’s open, engulfing the trade. And while it’s not as “textbook” as the one on the daily chart up above, it’s still a bearish engulfing pattern. The weekly chart seems to have run out of bullish momentum, stretching back to the 2nd week of March, or that big red bar 6 bars (weeks) ago. The 5-week moving average (blue) has turned flat and is now above the market, offering potential resistance at 66.97 today, while the 10-week (red) is below the market, offering potential support at 64.68. The 50- and 100- week averages (green/grey) are still well below the market near 54.52 and 49.25, respectively. Weekly stochastics (bottom sub-graph) are still in overbought condition, but are currently showing signs of decline. An interesting note, by my count the market has spent equal time (19 weeks/bar) being either completely overbought or oversold over the view of this chart.
Aggressive and well-margined traders may do well to consider short futures positions in July Soybean Oil. I would look for a higher price to sell into tomorrow, assuming we get a “Turnaround Tuesday” type of trade. The weekly chart suggests a short entry near the 5-week moving average at about 67.00. I think your risk, or a GTC Buy Stop protecting that position above today’s high, is near the 68.75 level. That would result in a loss of $1,050 per contract, before your commissions/fees. Set a GTC profit target just above the 50-day average at 63.15, which would result in a profit of $2,310 per contract, before your commissions/fees. If you’re the patient type, a profit target near the 100-day average at 57.55 may work better for you. Assuming that both the entry and the protective stop aren’t triggered on Tuesday, perhaps following the market down with a trailing stop just above the 10-day moving average would work out well for you.
For those of you that prefer options, I would suggest the July 63.00 Puts. July Bean Oil options expire in 74 days. The 63.00 Put settled at 1.685 today, or $1,011 out-of-pocket per option, before your commissions/fees. I would suggest a GTC target at 3x what you’ve paid for the options and plug in an alert to exit those options at ½ of what you paid for them. I wouldn’t recommend a GTC Sell Stop in the options, because sometimes option prices get skewed during the overnight trade. Rather, place an alert at/near 0.84 and exit that position at the market when triggered, if you think the market is going to sustain a move upward.
Sign Up to receive Walsh Trading’s 1st Half of 2026 Market Outlook First Half of 2026 Outlook for the Livestock and Grain markets.
If you like what you’ve read here and would like to see more like this from Walsh Trading, please Click here and sign up for our daily futures market email.
Jefferson Fosse Walsh Trading
Direct 312 957 8248 Toll Free 800 556 9411
jfosse@walshtrading.com www.walshtrading.com
Walsh Trading, Inc. is registered as a Guaranteed Introducing Broker with the Commodity Futures Trading Commission and an NFA Member.
Futures and options trading involves substantial risk and is not suitable for all investors. Therefore, individuals should carefully consider their financial condition in deciding whether to trade. Option traders should be aware that the exercise of a long option will result in a futures position. The valuation of futures and options may fluctuate, and as a result, clients may lose more than their original investment. The information contained on this site is the opinion of the writer or was obtained from sources cited within the commentary. The impact on market prices due to seasonal or market cycles and current news events may already be reflected in market prices. PAST PERFORMANCE IS NOT NECESSARILY INDICATIVE OF FUTURE RESULTS. All information, communications, publications, and reports, including this specific material, used and distributed by Walsh Trading, Inc. (“WTI”) shall be construed as a solicitation for entering into a derivatives transaction. WTI does not distribute research reports, employ research analysts, or maintain a research department as defined in CFTC Regulation 1.71.

/A%20close-up%20of%20a%20SpaceX%20sign%20by%20Sundry%20Photography%20via%20Adobe%20Stock.jpeg)

/AI%20(artificial%20intelligence)/AI%20chip%20by%203Dsss%20via%20Shutterstock.jpg)
