The Chart of the Day belongs to the healthcare company Cigna (CI). I found the stock by using Barchart's powerful screening functions to find stocks with the highest technical buy signals, highest Weighted Alpha, superior current momentum and having a Trend Seeker buy signal then used the Flipchart feature to review the charts for consistent price appreciation. Since the Trend Seeker first signaled a buy on 11/18 the stock gained 4.24%.
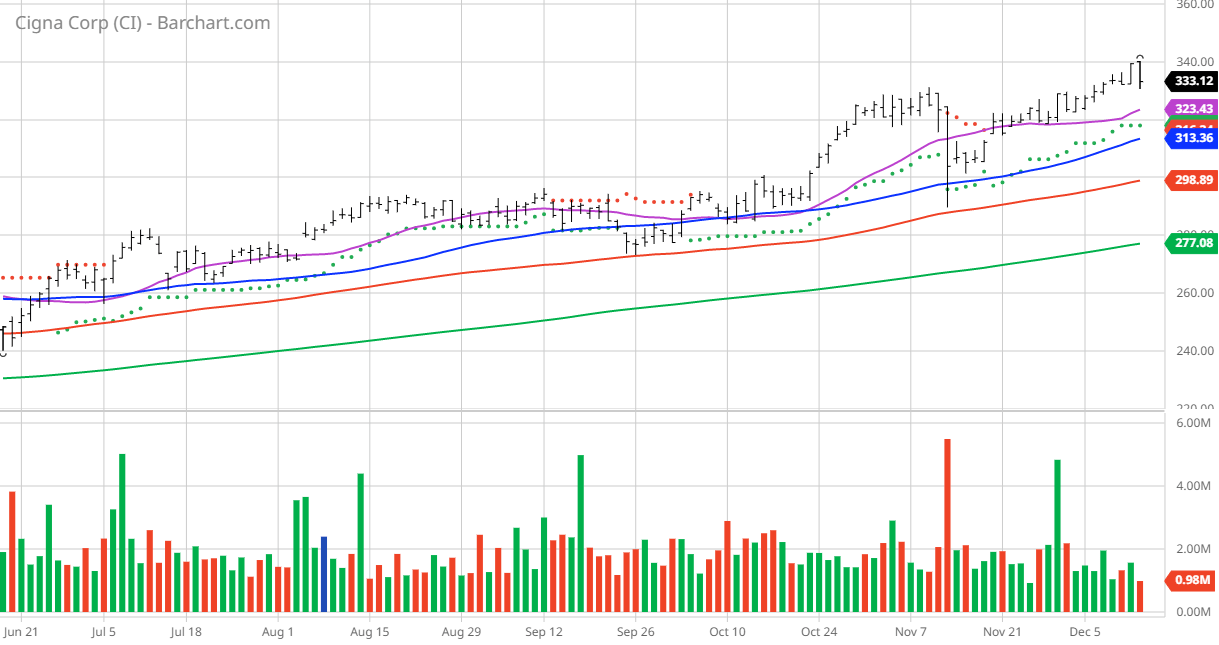
CI Price vs 20, 50,100 DMA ( )
Cigna Corporation provides insurance and related products and services in the United States. Its Evernorth segment provides a range of coordinated and point solution health services, including pharmacy, benefits management, care delivery and management, and intelligence solutions to health plans, employers, government organizations, and health care providers. The company's Cigna Healthcare segment offers medical, pharmacy, behavioral health, dental, vision, health advocacy programs, and other products and services for insured and self-insured customers; Medicare Advantage, Medicare Supplement, and Medicare Part D plans for seniors, as well as individual health insurance plans to on and off the public exchanges; and health care coverage in its international markets, as well as health care benefits for mobile individuals and employees of multinational organizations. The company also offers permanent insurance contracts sold to corporations to provide coverage on the lives of certain employees for financing employer-paid future benefit obligations. It distributes its products and services through insurance brokers and consultants; directly to employers, unions and other groups, or individuals; and private and public exchanges. The company was founded in 1792 and is headquartered in Bloomfield, Connecticut. (Yahoo Finance)
Barchart's Opinion Trading systems are listed below. Please note that the Barchart Opinion indicators are updated live during the session every 20 minutes and can therefore change during the day as the market fluctuates. The indicator numbers shown below therefore may not match what you see live on the Barchart.com website when you read this report.
Barchart Technical Indicators:
- 100% technical buy signals
- 53.06+Weighted Alpha
- 54.66% gain in the last year
- Trend Seeker buy signal
- Above its 20, 50 and 100 day moving averages
- 13 new highs and up 16.21% in the last month
- Relative Strength Index 6.52%
- Recently traded at $331.53 with 50 day moving average of $313.35
Fundamental Factors:
- Market Cap $104 billion
- P/E 14.41
- Dividend yield 1.32%
- Revenue expected to grow by 3.80% this year and another 5.20% next year
- Earnings estimated to increase 13.20% this year, an additional 7.20% next year and continue to compound again at an annual rate 11.48% for the next 5 years
Analysts and Investor Sentiment -- I don't buy stocks because everyone else is buying but I do realize that if major firms and investors are dumping a stock it's hard to make money swimming against the tide:
- Wall Street analysts have 8 strong buy, 5 buy and 10 hold opinions in place on this stock
- Analysts have price targets from $230.00 to $385.00 with an average of $349.00 - wide range
- The individual investors following the stock on Motley Fool voted 376 to 44 for the stock to beat the market with more experienced investors voting 92 to 5 for the same result
- 32,770 investors are monitoring this stock on Seeking Alpha
Disclosure: I/we have a beneficial long position in the shares of CI either through stock ownership, options, or other derivatives.
Additional disclosure: The Barchart Chart of the Day highlights stocks that are experiencing exceptional current price appreciation. They are not intended to be buy recommendations as these stocks are extremely volatile and speculative. Should you decide to add one of these stocks to your investment portfolio it is highly suggested you follow a predetermined diversification and moving stop loss discipline that is consistent with your personal investment risk tolerance and reevaluate your stop losses at least on a weekly basis.
On the date of publication, Jim Van Meerten did not have (either directly or indirectly) positions in any of the securities mentioned in this article. All information and data in this article is solely for informational purposes.
/Nvidia%20logo%20and%20sign%20on%20headquarters%20by%20Michael%20Vi%20via%20Shutterstock.jpg)


/Intel%20Corp_%20Santa%20Clara%20campus-by%20jejim%20via%20Shutterstock.jpg)