/Amazon%20pickup%20%26%20returns%20building%20by%20Bryan%20Angelo%20via%20Unsplash.jpg)
Again, the tech giant Amazon (AMZN) has become the center of the larger discussion about whether Big Tech companies might be overreaching in their ambitions to control the artificial intelligence market. The company's plan to invest in capital expenditure worth up to $200 billion by 2026 certainly makes investors uneasy, as they have trouble reconciling such high expenses with free cash flow problems.
Nevertheless, this seems to be premature criticism. Across the sector, companies are intensifying their efforts in securing compute capacity and building AI infrastructure. Against this background, Amazon's capex can be seen as an attempt to position itself better in the rapidly growing market rather than excessive spending. AWS growth has been picking up, while monetization layers have emerged, and this might explain why a recent pullback can be interpreted as an investment opportunity.
About Amazon Stock
Amazon is considered one of the leading platform companies globally due to its presence in e-commerce, cloud computing, digital advertising, AI infrastructure, and custom silicon. The company's headquarters is located in Seattle and has a market cap of about $2.29 trillion, making AMZN a core holding for institutional investors.
Presently, Amazon's stock is traded at $221, representing about a 14.6% decline compared to its 52-week high ($258.60) and more than a 33% gain against its 52-week low ($165.29). Last week, shares soared by more than 6%. While the performance of AMZN stock was superb, it still didn't reflect the true strength of the underlying business operations.
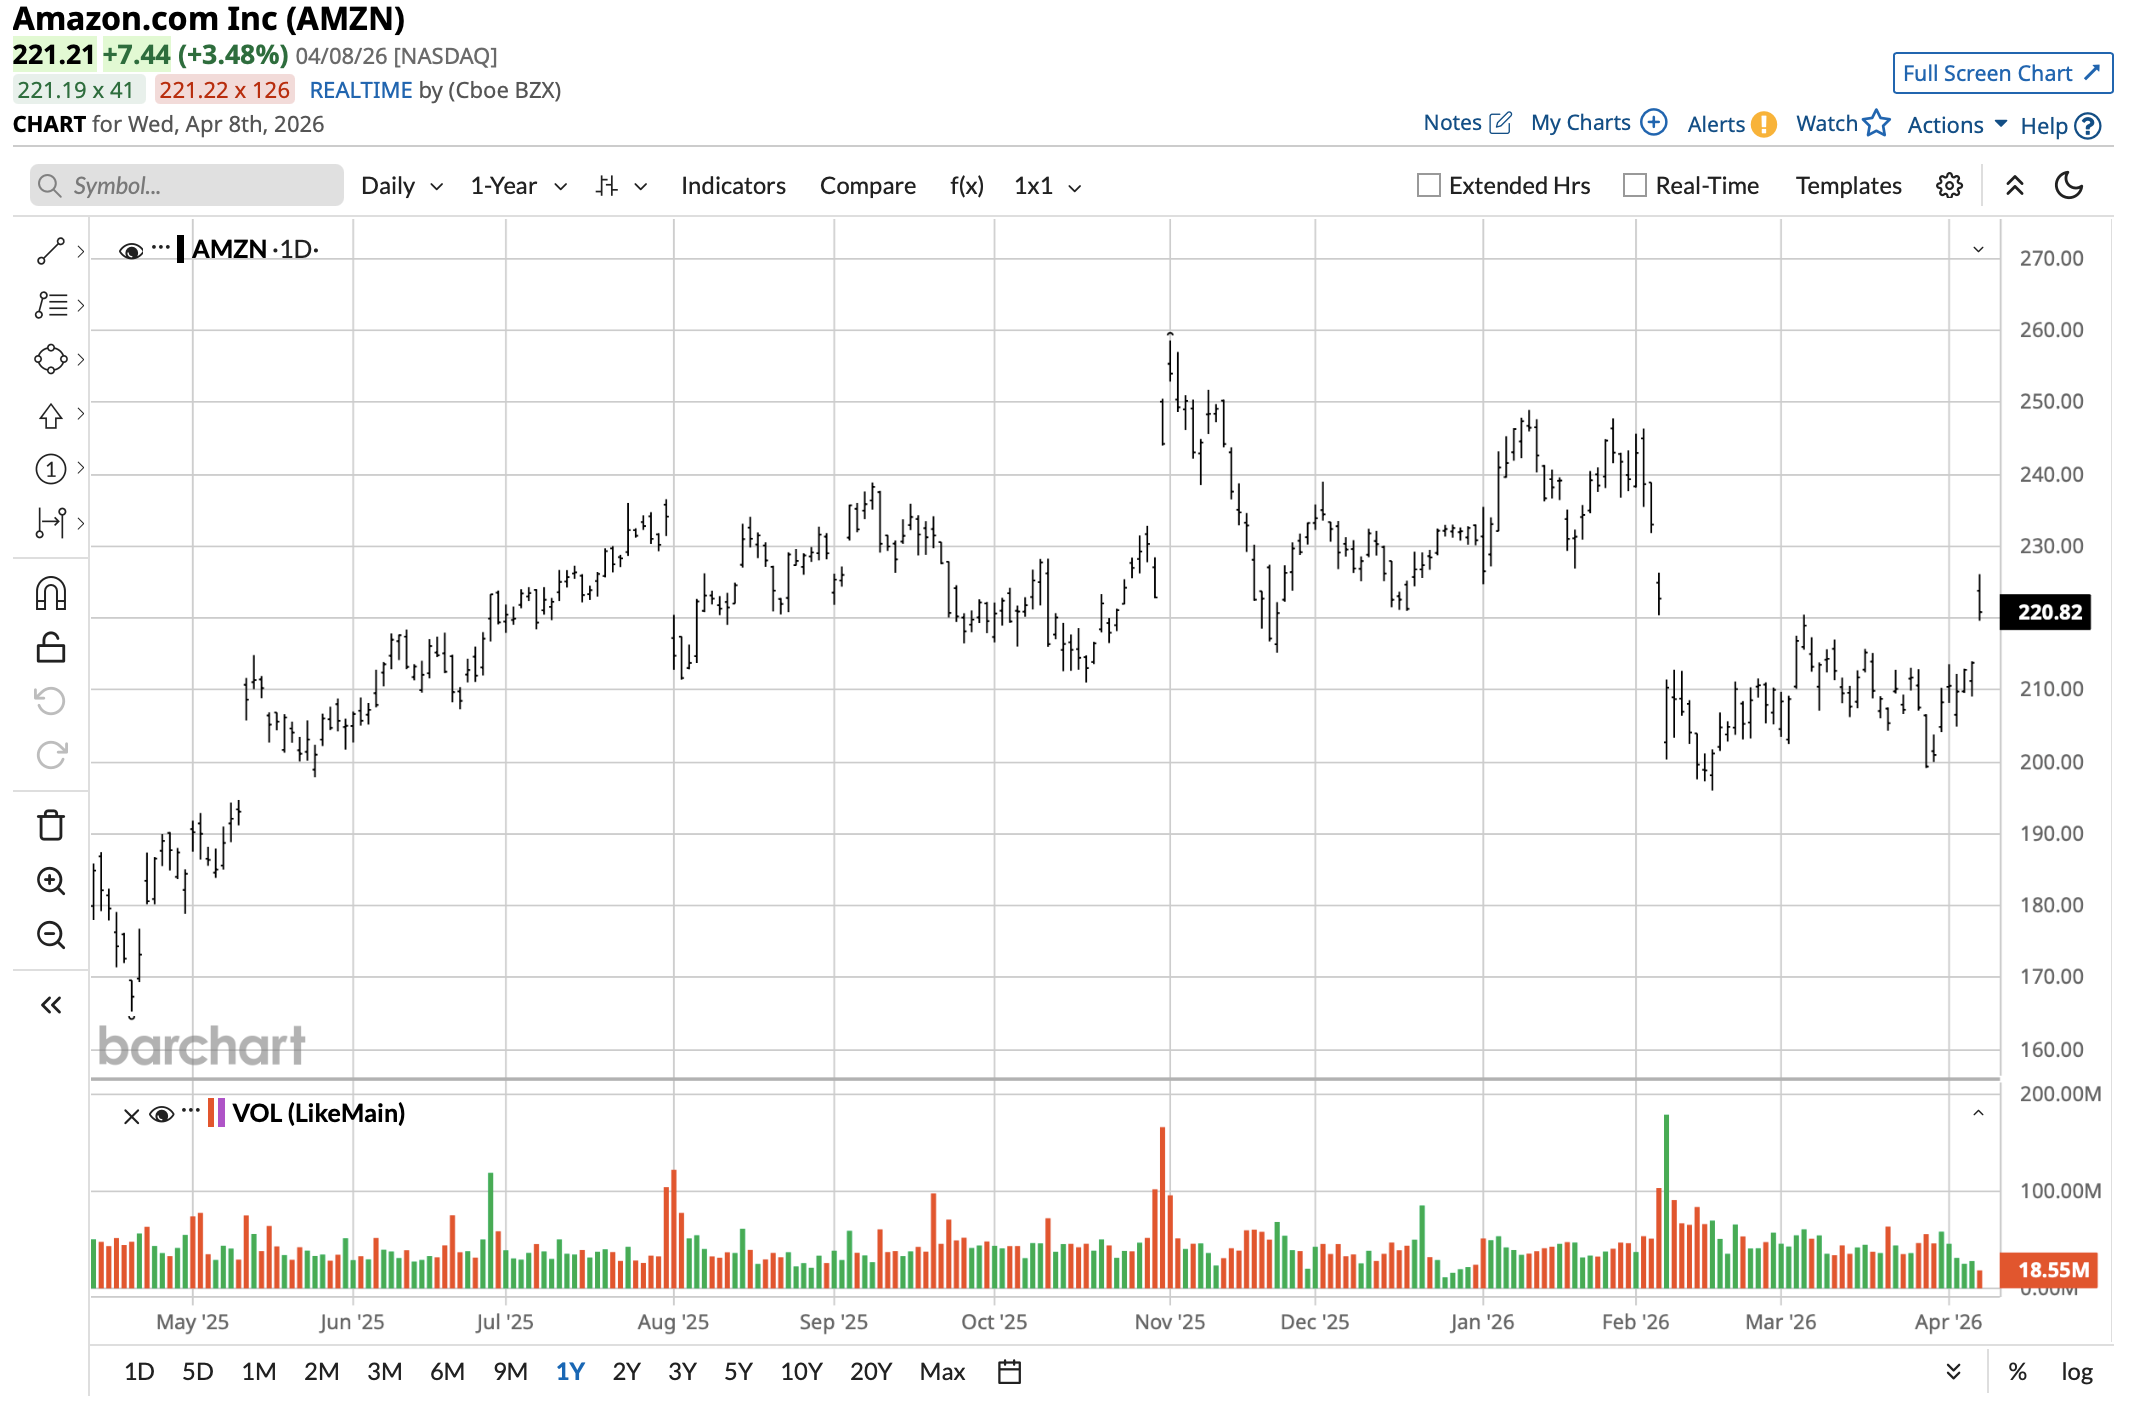
The valuation of the company seems justified because of its solid financials and growth perspective. Currently, AMZN is trading at a P/E ratio of 29.68, a forward P/E ratio of 26.98, a price/sales ratio of 3.19, and a P/CF ratio of 15.70. The profitability of the company appears excellent, with an RoE of 21.87% and profit margins higher than 10%. Thus, the stock might appear to be undervalued compared to other stocks in the market.
Amazon Beats on Earnings
The latest quarterly report provides further evidence that Amazon is a well-run company with great operational efficiency. In Q425, net sales grew 14% year-over-year (YoY) to $213.4 billion, while AWS revenue rose 24% YoY to $35.6 billion, which was the best performance of the cloud service provider in more than a year. Additionally, operating income reached $25.0 billion (+18.3% YoY), and net income amounted to $21.2 billion, or $1.95 per share.
On the annual level, Amazon managed to grow its sales by 12% to $716.9 billion, while operating income improved to $80.0 billion (+16.5% YoY). Net income increased to $77.7 billion demonstrating significant earnings leverage across different segments. As we see, there is no sign of struggle in Amazon's results despite the rising expenses.
As expected, free cash flow fell sharply by -$27 billion (YoY). Indeed, capital expenditures surged by $50.7 billion, mostly due to investments in AI infrastructure. It should be mentioned that this trend doesn't seem to indicate any weakness of the company, as the decrease in free cash flow is driven by spending rather than weak revenues or profit margins.
However, Amazon's management keeps moving forward and strengthens its competitive advantages. The cloud service provider gains momentum in the enterprise sector, its custom silicon chips like Trainium and Graviton get deployed faster and faster, and services such as Bedrock expand its capabilities in the AI space. All of these projects have already generated revenue and strengthened the company's position.
What Do Analysts Expect for AMZN Stock?
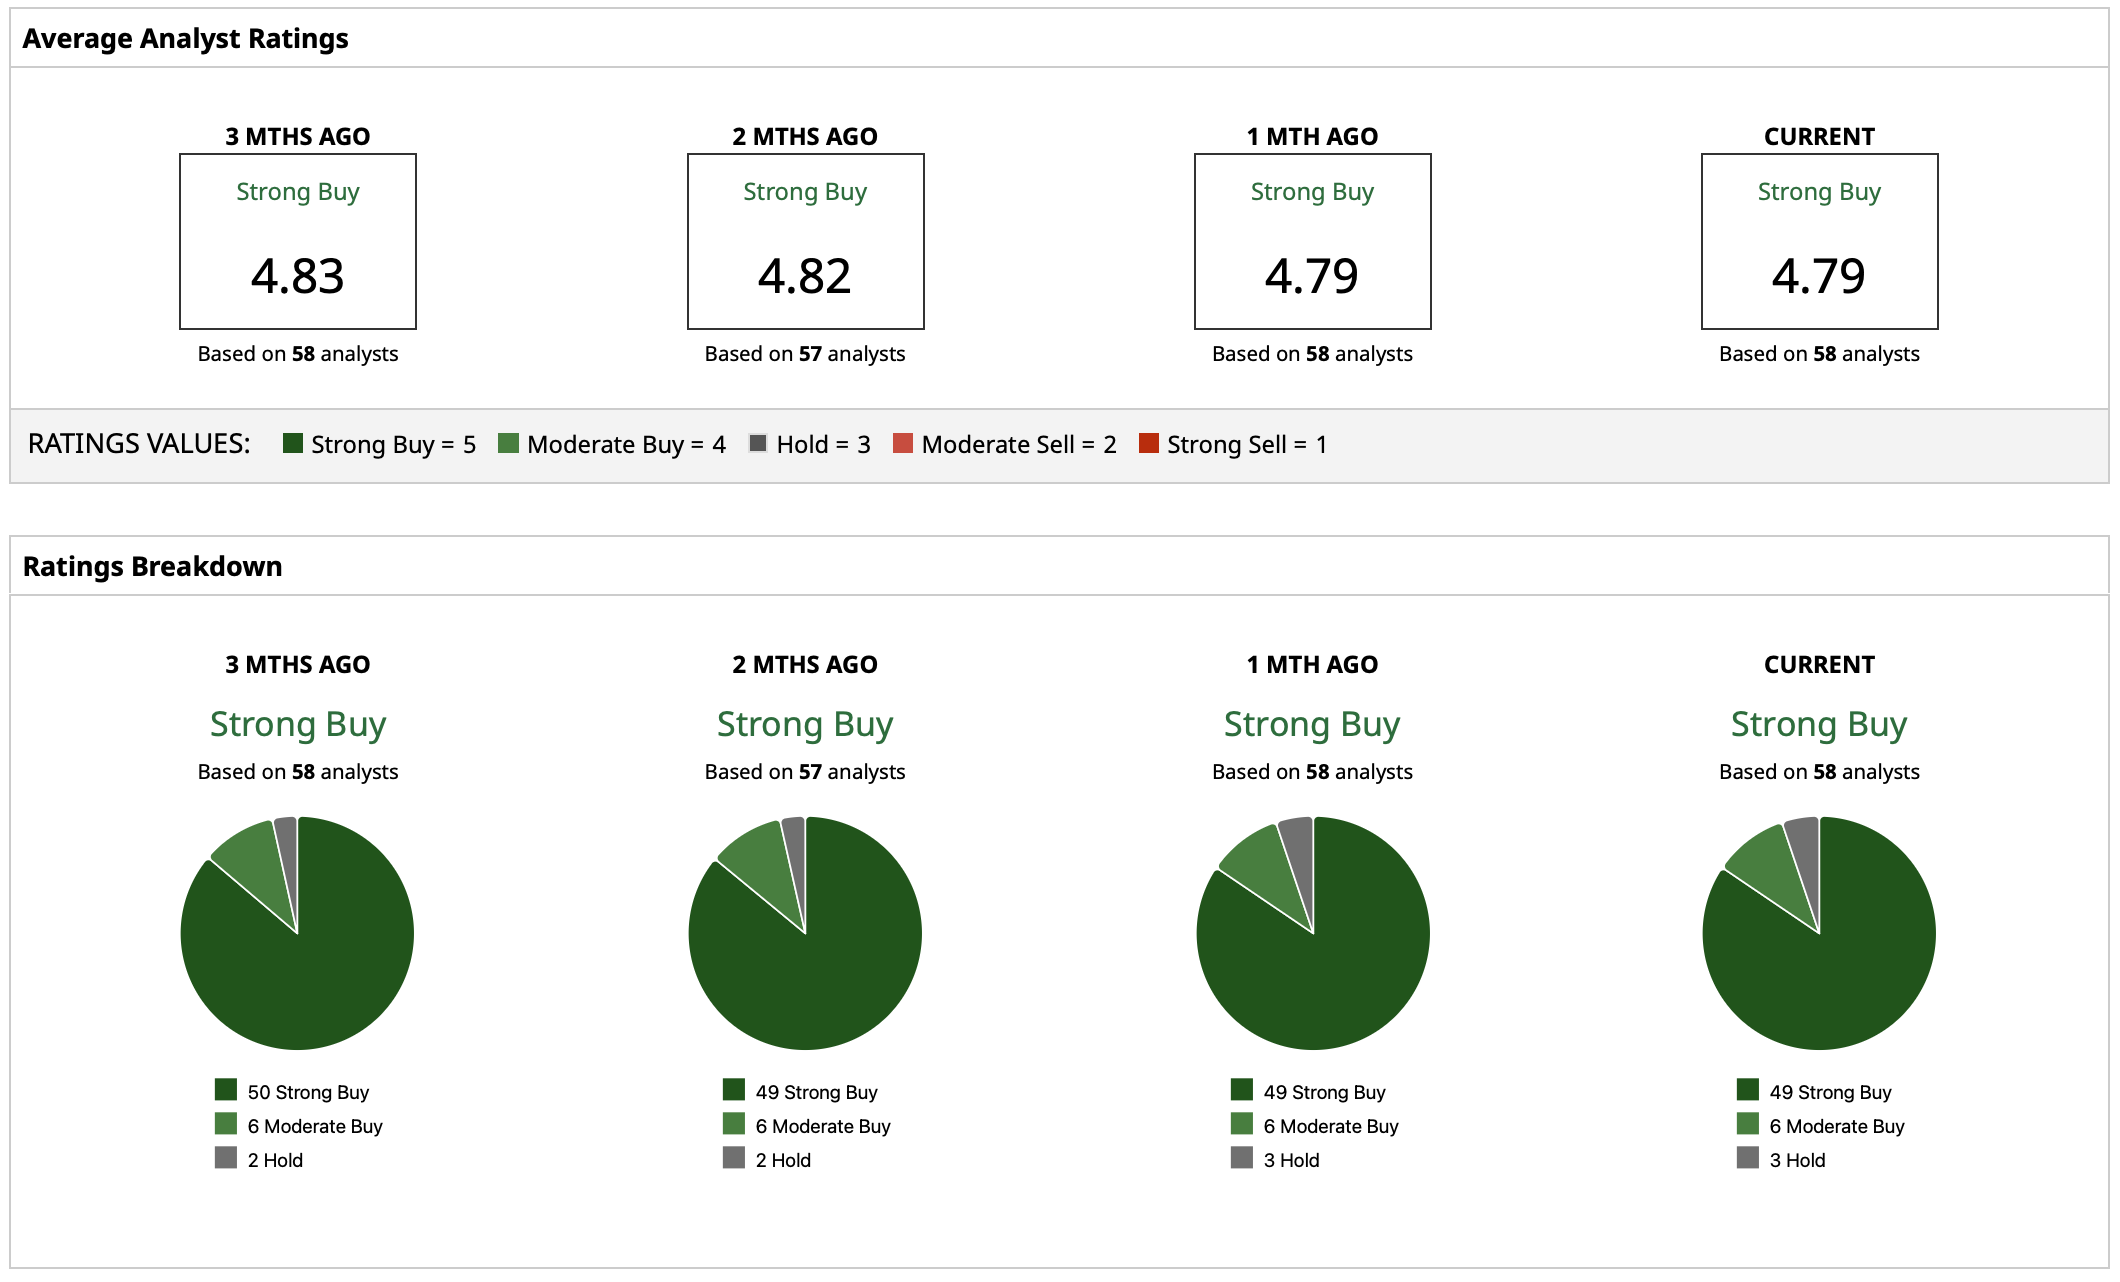
Even though the problem with capex spending exists, Wall Street maintains its positive sentiment towards AMZN stock, assigning a "Strong Buy" rating consensus, and only a few analysts changed their recommendations to bearish ones. The average target price of AMZN stock stands at $285.75, implying a 29% upside potential from current levels.
On the date of publication, Yiannis Zourmpanos did not have (either directly or indirectly) positions in any of the securities mentioned in this article. All information and data in this article is solely for informational purposes. For more information please view the Barchart Disclosure Policy here.
/An%20Intel%20sign%20out%20front%20of%20a%20corporate%20office%20by%20wolterke%20via%20Adobe%20Stock.jpeg)


/United%20Parcel%20Service%2C%20Inc_%20logo%20on%20truck-by%20100pk%20via%20iStock.jpg)
/Micron%20Technology%20Inc_%20logo%20on%20building-by%20vzphotos%20vis%20iStock.jpg)