

- Our three key reads on real corn fundamentals; cash, futures spreads, and basis, all continue to show a more bullish supply and demand situation than a year ago.
- On the other, the Barchart National Corn Price Index, the intrinsic value of the market, computed a technical top this past May indicating long-term fundamentals were set to change down the road.
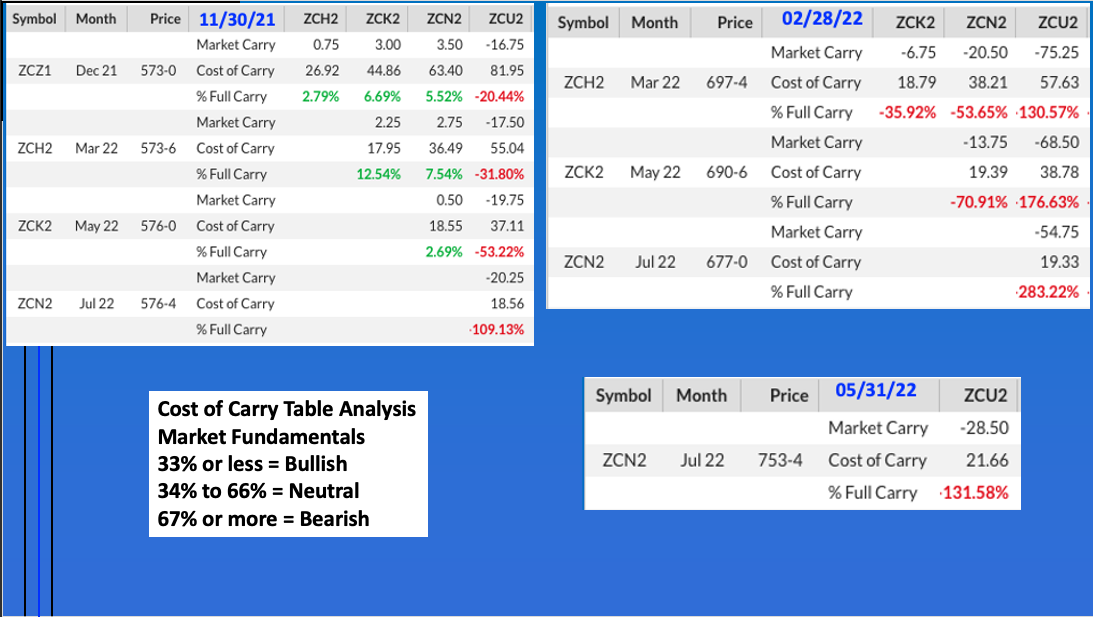
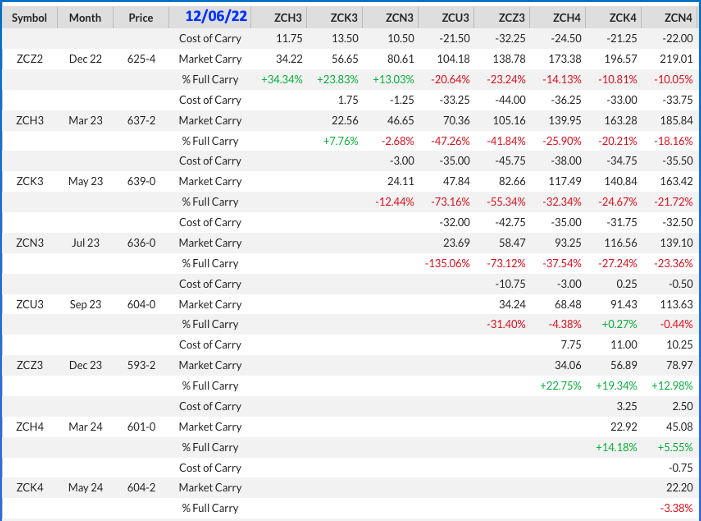
- This could limit spread activity over the coming months, possibly keeping the March-May, May-July, and July-September spreads from reaching last year's lofty inverse levels.
I was recently asked how strong the inverse will be in the March-May, May-July, and July-September corn futures spreads as we make our way through 2023. If we take a look at the 2022 futures spreads quarterly (end of November, February, and May) we see the progression of corn’s fundamentals growing more bullish. The March-May ended November covering 13% calculated full commercial carry (cfcc) while the May-July covered 3% cfcc and the July-September was already inverted by 20.25 cents. By the end of February, the three spreads were all inverted by 6.75 cents, 13.75 cents, and 54.75 cents respectively. At the end of May, the July-September had stretched its inverse to 28.5 cents.
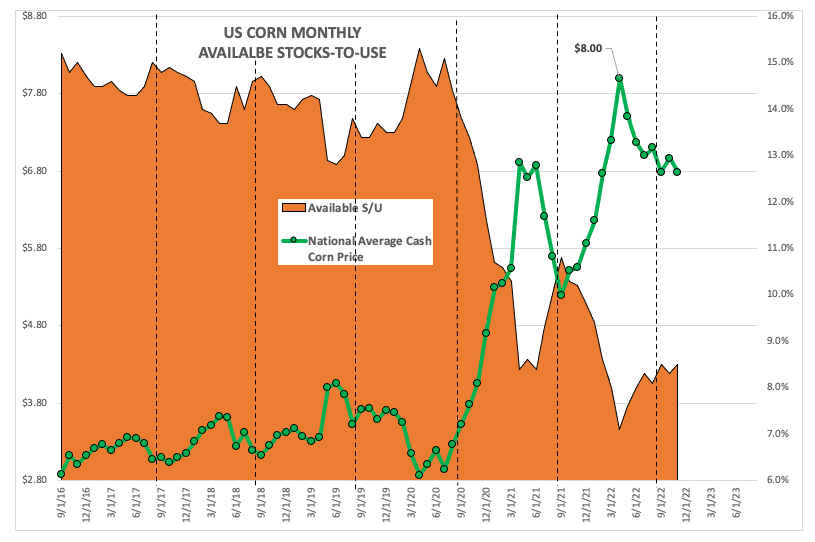
Now we can add in the fact the 2022-2023 supply and demand situation is more bullish than last year at this same time. At the end of November 2022, the national average cash price was near $6.7850, correlating to an available stocks-to-use calculation of 8.5% as compared to the previous November’s $5.56 and 10.2%. As the 2021-2022 marketing year played out, the national average cash price climbed to $8.00 at the end of April, putting available stocks-to-use at 7.1%. This outdistanced the previous high of $7.9750 at the end of July 2012, also correlating to an available stocks-to-use of 7.1%.
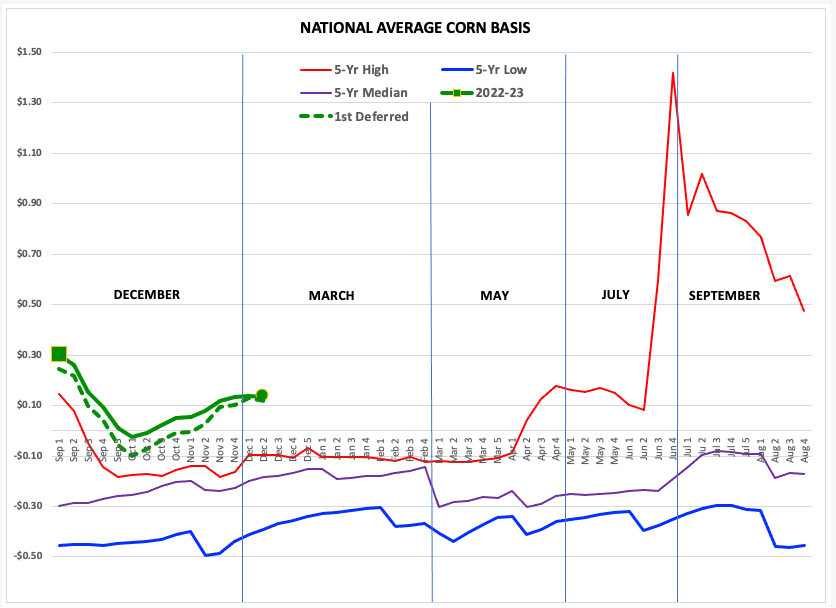
We can also see this year’s supply and demand situation is tighter than a year ago by looking at the seasonal weekly close-only chart for the national average basis market. The 2022-2023 marketing year (solid green line) continues to run about 25 cents stronger than the previous 5-year high weekly closes (red line), dominated by last year’s marks. Given our three fundamentals reads were more bullish through Q1 of 2022-2023, the logical assumption is the rest of the marketing year should play out the same.
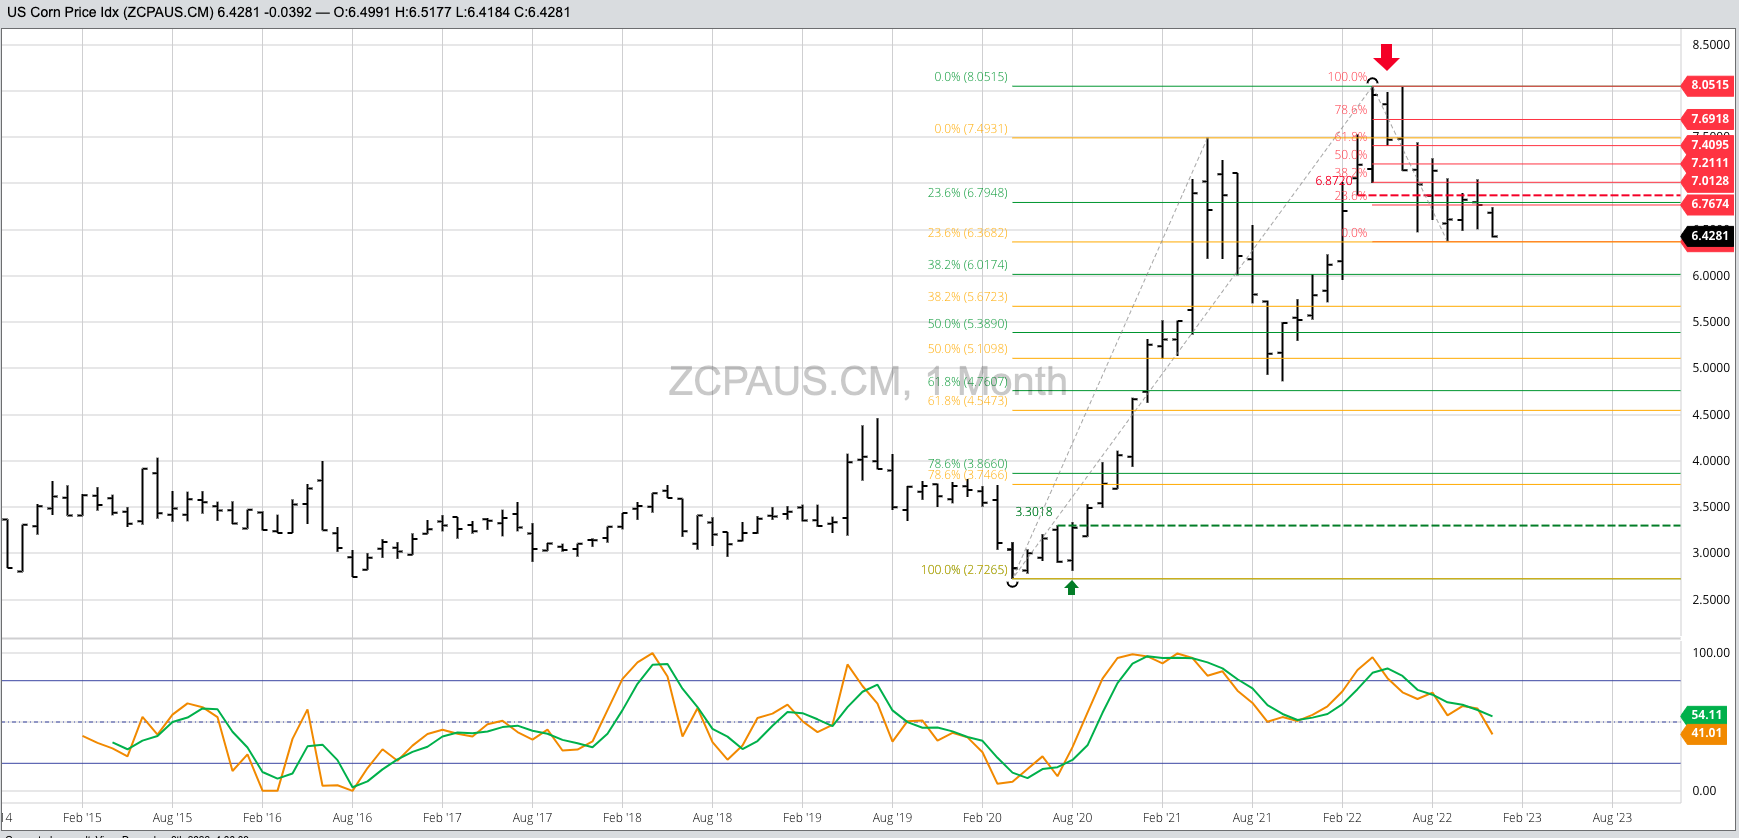
But as Coach Lee Corso would say, “Not so fast my friend.” A look at the monthly chart for the Barchart National Corn Price (ZCPAUS.CM), the weighted national average cash price, and we see a reversal pattern was completed last May and confirmed during July. If we apply the first premise of technical analysis, market action discounts everything, then the intrinsic value of corn told us the fundamental situation was set to grow less bullish over time. As I’ve talked about in the past, the downside targets for the NCPI are near $6.0175 and $5.39, with the index calculated near $6.43.
As we head home Tuesday, all three of the 2023 futures spreads are trending down. While still bullish, this tells us the commercial side is growing more comfortable with long-term supply and demand. While supplies won’t change much over the coming months, all three legs of demand could face challenges. Exports were dismal through late November with the pace of shipments projecting total export demand for 2022-2023 of 1.4 bb, as compared to last year’s reported shipments of 2.35 bb. Ethanol demand could stay constant, making feed demand the wildcard. Much of the talk is of lower placements meaning less cattle on feed, a possibility that could show up once we get into Q3 of the marketing year.
More Grain News from Barchart
- Coffee Moves Higher as Brazil's Farmers Withhold Coffee in Hopes of Higher Prices
- Sugar Prices Under Pressure as Crude Oil Slumps
- NY Cocoa Rises on Concerns About West African Cocoa Crop Quality
- Wheat Bulls Still Have Zero Traction

/Jen-Hsun%20Huan%20NVIDIA's%20Founder%2C%20President%20and%20CEO%20by%20jamesonwu1972%20via%20Shutterstock.jpg)

/Palantir%20(PLTR)%20by%20Piotr%20Swat%20via%20Shutterstock.jpg)
