Your browser of choice has not been tested for use with Barchart.com. If you have issues, please download one of the browsers listed here.
Barchart Premier: The most comprehensive method for keeping track of all your investments. FREE 30 Day Trial
Stocks | Futures | Watchlist | More
or

PG&E Citygate "Pipe" Option Feb '16 (JXQG16)

[[ item.lastPrice ]] [[ item.priceChange ]] ([[ item.percentChange ]]) [[ item.tradeTime ]] [NYMEX]
[[ item.bidPrice ]] x [[ item.bidSize ]] [[ item.askPrice ]] x [[ item.askSize ]]
[[ rootItem.symbol ]]underlying price [[ rootItem.lastPrice ]] [[ rootItem.priceChange ]] ([[ rootItem.percentChange ]]) [[ rootItem.tradeTime ]]
Quote Overview for [[ item.sessionDateDisplayLong ]]
[[ rowChartData.labelLow ]]
[[ rowChartData.lowPriceFormatted ]]
[[ rowChartData.lowPrice ]]
[[ rowChartData.labelHigh ]]
[[ rowChartData.highPriceFormatted ]]
[[ rowChartData.highPrice ]]
since [[ rowChartData.lowDate ]]
since [[ rowChartData.highDate ]]
[[ value ]] [[ value ]]

Contract Specifications

See More
Contract
N/A
Contract Size
N/A
Tick Size
N/A
Trading Hours
N/A
Exchange
NYMEX
Point Value
$100
Expiration Date
01/29/16 (expired)
Get Realtime - Quotes and Charts for Futures Traders. Learn More >>

More PG&E Citygate "Pipe" Option Quotes

All Futures Prices
Please wait...

Most Recent Stories

More News
Pure Hedge - Livestock and Grain

Grains Much Higher, as Feeders Fall.

SPDR Energy Select Sector ( $XLE) Found Buyers at the Blue Box Area as Expected.

Hello everyone. In today’s article, we will look at the past performance of the 4H Hour Elliott Wave chart of SPDR Energy Select Sector (XLE) . The rally from 1.18.2024 low at $78.98 unfolded as 5 waves...

XLE : 93.30 (+0.79%)
Soybean Rally Leads to 4-Month High

Soybeans ended the Monday session withing a few cents from the day’s high. Contracts were up 15 ¾ to 33 ¾ cents across the board at the close. Forecasts for heavy rain totals in Southern Brazil, on...

ZMN24 : 387.6s (+4.14%)
ZLN24 : 43.84s (+1.76%)
ZSK24 : 1234-6s (+2.75%)
ZSPAUS.CM : 11.8813 (+2.78%)
ZSN24 : 1248-6s (+2.78%)
ZSX24 : 1219-6s (+1.56%)
ZSPX24US.CM : 11.5790 (+1.64%)
Wheat Rallies From Overnight Weakness as KC Hits 5 Month High

The wheat complex faced initial selling overnight, but bulls woke up with a vengeance to rally all three exchanges on Monday. Chicago contracts ended out the day with gains of as little of 10 ¼ cents...

ZWK24 : 632-2s (+4.33%)
ZWN24 : 648-6s (+4.22%)
KEK24 : 685-0s (+3.79%)
KEN24 : 675-2s (+3.84%)
MWK24 : 708-2s (unch)
Cattle Mostly Lower on Monday, as Feeders pressured by Corn Strength

Live cattle closed the Monday session with contracts down 15 to 87 cents across most contracts, as June was the lone higher contract, up 15 cents. Cash trade was slow to develop last week, with sales of...

LEM24 : 176.975s (+0.17%)
LEQ24 : 174.425s (-0.09%)
LEV24 : 177.875s (-0.10%)
GFK24 : 241.400s (-0.78%)
GFQ24 : 252.875s (-0.74%)
GFU24 : 253.875s (-0.74%)
Hogs on the Lower Side of Steady to Start the Week

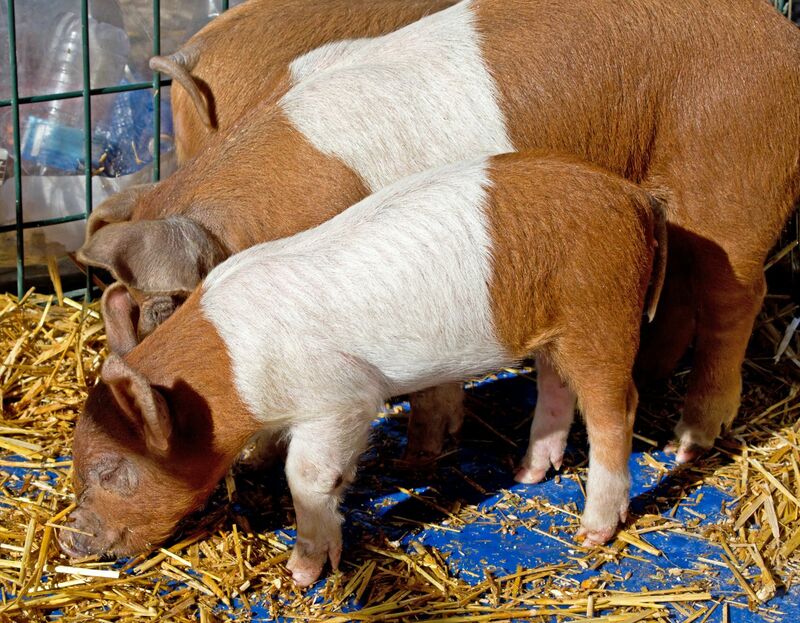
Lean hogs settled the Monday session with contracts steady to 77 cents lower. USDA’s National Average Base Hog negotiated price was up $3.03 in the Monday afternoon report at $92.41. The CME Lean Hog...

HEK24 : 92.175s (-0.27%)
HEM24 : 98.175s (-0.78%)
HEN24 : 102.150s (-0.68%)
Corn Rallies into Monday Close, USDA Confirms Slowdown to Planting Pace

Corn quickly erased the overnight weakness once the day session began, as contracts rallied throughout the day. Futures were up anywhere from 2 to 10 cents across the board, with the strength led by the...

ZCK24 : 457-0s (+2.24%)
ZCPAUS.CM : 4.4585 (+1.83%)
ZCN24 : 469-0s (+1.90%)
ZCZ24 : 488-4s (+1.19%)
ZCPZ24US.CM : 4.5895 (+1.39%)
Cotton Resumes Slide on Monday

The cotton market resumed its slide on Monday, as contracts were down 22 to 100 points at the close. The outside influences had little effect, as the US dollar index was up 42 points, with crude oil 57...

CTK24 : 76.56s (-1.03%)
CTN24 : 77.06s (-1.28%)
CTZ24 : 75.31s (-0.87%)
XME Elliott Wave : Buying The Dips at the Blue Box Area

Hello fellow traders.  In this technical blog we’re going to take a quick look at the Elliott Wave charts of (XME) ETF, published in members area of the website. As our members know XME is showing...

XME : 61.08 (+0.39%)
EURGBP Perfectly Reacting Lower From Blue Box Area

In this technical blog, we are going to take a look at the past performance of (EURGBP) 4-Hour Elliott wave Charts that we presented to our members. In which, the decline to 2/14/2024 low took place as...

^EURGBP : 0.85731 (unch)

Key Turning Points

3rd Resistance Point N/A
2nd Resistance Point N/A
1st Resistance Point N/A
Last Price N/A
1st Support Level N/A
2nd Support Level N/A
3rd Support Level N/A

See More

52-Week High 0.0000
Fibonacci 61.8% N/A
Fibonacci 50% N/A
Fibonacci 38.2% N/A
52-Week Low 0.0000

See More

Want to use this as
your default charts setting?
Save this setup as a Chart Templates
Switch the Market flag
for targeted data from your country of choice.
Open the menu and switch the
Market flag for targeted data from your country of choice.
Want Streaming Chart Updates?
Switch your Site Preferences
to use Interactive Charts
Need More Chart Options?
Right-click on the chart to open the Interactive Chart menu.

Free Barchart Webinar