
Treasury bonds have gone from a hot potato asset nobody wanted to hold to an asset that has staged a historically sharp rally. Like most rallies, capitulation selling made it possible. Panicked selling in government-issued fixed-income securities left investors sidelined and speculators massively short the market. However, the COT (Commitments of Traders) data via the CFTC (Commodity Futures Trading Commission) tells us that we are merely beginning to unwind what was one of the most significant overcrowded trades in history.
A similarly bearish net short position occurred in the 10-year note futures in 2018; from late 2018 through early 2020, as speculators flipped from short to long, the market rallied over 20 handles, causing a decline in yield of over 2.5%. One could argue that it took a black swan event to facilitate the move, but we don’t know what the future has in store for us, and black swans aren’t as rare as they once were. Further, with speculators still holding historically aggressive short positions and a plethora of cash on the sidelines, a 2.5% decline in yields from high to low can occur despite fundamentals. Sometimes, lopsided positioning is a more significant price driver than fundamental narratives.
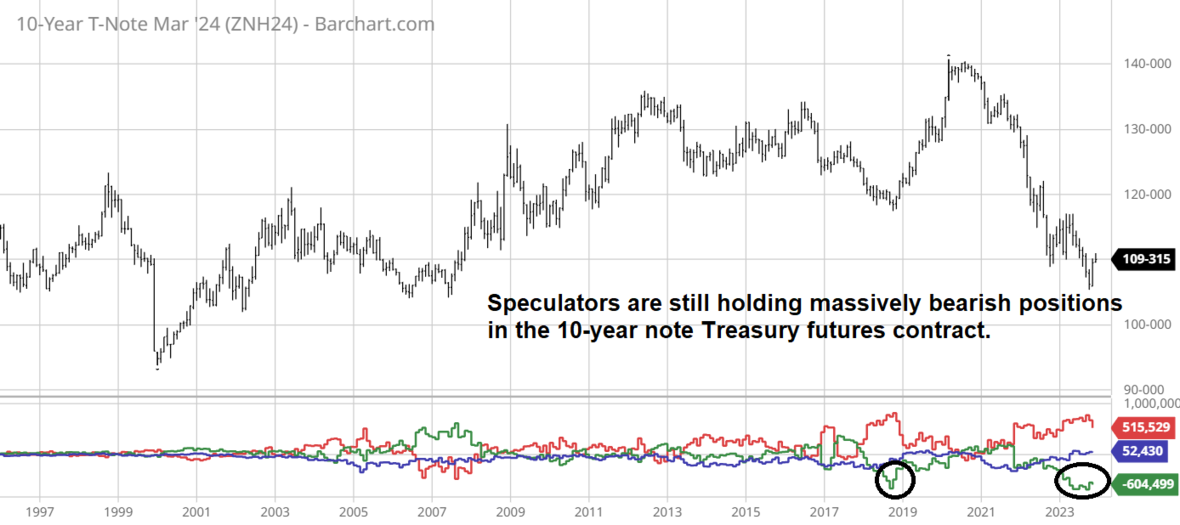
A monthly chart of the 10-year note futures contract reveals an RSI (Relative Strength Index) showing promising upward momentum after a multi-month divergence event in which the futures market made new lows, but the RSI did not. This divergence between the market and oscillator suggested the selling was drying up in October, as it did. It generally indicates a trend change rather than a simple bounce. Given the size and magnitude of the recovery rally and noted chart resistance in the 111’15 area, or 4% yield, we would expect some consolidation or even back-and-fill price action. Nevertheless, the odds are the unwinding of the massive bearish Treasury trade continues, and the price not only breaks above the 111’15 resistance but also makes its way toward 117’10, or 3.25%. This type of move can happen without any action taken by the Fed. Just as the market did much of the heavy lifting during the rate hike cycle, it can contribute toward easing. In other words, short covering and FOMO (Fear of Missing Out) buying via sidelined cash can swing benchmark interest rates into the low 3% area. If the Fed initiates an easing campaign, we see 124’0 (nearly 2%) as a probable target. Complacent Treasury bears might learn the hard way that risk comes fast.

The US Dollar will Fizzle in a Stable or Lower Interest Rate Environment
Stable-to-lower interest rates will “right a lot of wrongs” in other markets. What I mean by this is it will continue to put downward pressure on the US dollar, which, in itself, is supportive of most assets. Looking at crude oil specifically, the correlation between the dollar and oil has failed to hold its historical norm since the inflation event of 2022. Before that, a higher dollar would generally result in lower oil prices and vice versa. But as the world attempted to hedge inflation and interest rate risk, intermarket correlations ran amok. However, as interest rates and currencies normalize, we believe the standard negative correlation between the US dollar and crude oil will return. If so, given the overall decline in the dollar from its peak, we should see oil selling start to dry up sooner rather than later.
A weekly dollar chart depicts a market that has retreated from 2022 highs but is still above what history suggests is a more comfortable trading range (100.00 to 95.00). We did see the dollar hover in the lower 90.00s in reaction to the Covid relief stimulus and in the years following the financial crisis, but in more normal conditions, it generally gravitates to the 100.00/95.00 area. With the RSI making its way lower and as long as resistance near 107.00 holds, the path of least resistance remains lower. Even if we don’t fall below 100.00, a simple move to test that area would be enough to support energies, metals, and financials such as Treasuries. Some might call it the green light of an “everything rally.”

A Weaker Dollar and Stable Interest Rates Should Help Oil Prices Firm Up
The chart below compiles 30 years of data using the March crude oil future to determine the most likely times for annual highs and lows. As we can see, oil seasonality turns bullish in the second or third week of December.

We have drawn a trendline on the monthly oil futures chart dating back to the 2015 low. This trendline has managed to contain selling since then, except for the COVID crisis that was exacerbated by an OPEC+ price war. Although we don’t have a crystal ball, the odds of a COVID-type black swan event in the coming months are minuscule, and we doubt OPEC+ will reopen those wounds. Thus, we expect prices to hold support near $68.00. In fact, last week’s low was in the vicinity of this, so the lows of this move might be in, but if not, we believe they are near. Keep in mind chart lines are an art rather than a science. A monthly trendline at $68.00 doesn’t mean we can’t temporarily dip to $66.00 or even $65.00 before turning around as expected. If this area does hold, we see a return to $100 per barrel. The uber bulls are pointing toward $115.00 and $127.00 as possible targets, but we aren’t that bullish. We believe technology will continue to thwart demand and improve production efficiency.

We aren’t sure which market is the tail and which is the dog, but we’ve noticed the correlation between crude oil and natural gas has strengthened over the last 30 days to about 90%. Thus, if one bottoms, the other should as well. The gas market is extremely oversold on most time frames; the Williams %R on a weekly basis has been a relatively nice tell that selling is drying up and the downside is limited. On most occasions, a dip below 25.00 has triggered a reversal rally; on others, it has simply slowed down the selling to stabilize prices. The weekly Williams %R in natural gas futures is near 10.00, well into oversold territory. The weekly trendline is near $2.12, moderately lower than the recent low, but we’ve seen the $2.25/$2.30 act as a pivot in the past, so buyers might be interested in that level.

Conclusion
In summary, we believe interest rates will remain stable in the short term and continue lower in the long term. As a result, the US dollar will continue to decline into a more historically comfortable price range to take away some of the headwinds working against both oil and natural gas.
*There is substantial risk of loss in trading futures and options. There are no guarantees in speculation; most people lose money trading commodities. Past performance is not indicative of future results.
Seasonality is already factored into current prices, any references to such does not indicate future market action.
**There is substantial risk of loss in trading futures and options.** These recommendations are a solicitation for entering into derivatives transactions. All known news and events have already been factored into the price of the underlying derivatives discussed. From time to time persons affiliated with Zaner, or its associated companies, may have positions in recommended and other derivatives. Past performance is not indicative of future results. The information and data in this report were obtained from sources considered reliable. Their accuracy or completeness is not guaranteed. Any decision to purchase or sell as a result of the opinions expressed in this report will be the full responsibility of the person authorizing such transaction. Seasonal tendencies are a composite of some of the more consistent commodity futures seasonals that have occurred over the past 15 or more years. There are usually underlying, fundamental circumstances that occur annually that tend to cause the futures markets to react in similar directional manner during a certain calendar year. While seasonal trends may potentially impact supply and demand in certain commodities, seasonal aspects of supply and demand have been factored into futures & options market pricing. Even if a seasonal tendency occurs in the future, it may not result in a profitable transaction as fees and the timing of the entry and liquidation may impact on the results. No representation is being made that any account has in the past, or will in the future, achieve profits using these recommendations. No representation is being made that price patterns will recur in the future.
On the date of publication, Carley Garner did not have (either directly or indirectly) positions in any of the securities mentioned in this article. All information and data in this article is solely for informational purposes. For more information please view the Barchart Disclosure Policy here.

/Oracle%20Corp_%20logo%20on%20phone%20and%20stock%20data-by%20Rokas%20Tenys%20via%20Shutterstock.jpg)
/Green%20hydrogen%20by%20Scharfsinn%20via%20Shutterstock.jpg)

/NVIDIA%20Corp%20logo%20on%20phone%20and%20AI%20chip-by%20Below%20the%20Sky%20via%20Shutterstock.jpg)