
What is Trend?
A market trend is a propensity for prices to move in a particular path over time. These trends can be classified as long-term, medium, and short time frames. Many traders identify market trends using technical analysis, illustrating market trends as probable price direction tendencies.
For this article, we will discuss using moving averages for trend analysis.
What is a Moving Average?
Traders use moving averages as a technical analysis tool to smooth out price data. Think of it as eliminating the erratic noise to visually represent where a market is moving. The calculation studies many data points to create a series of arithmetic means, each representing a different period.
For example, a market can experience significant swings up or down during a trading month. Although these price swings are accurate, their randomness must represent a clear direction for analyzing price trends. Thus, by using moving averages of this randomness, one can better understand a market's price trends.
How to use Moving Averages for Trend Analysis
Moving averages are calculated by adding up multiple data points, usually closing prices, during a particular period and then dividing that sum by the number of periods used.
To calculate an 18-day moving average, for example, you would add up the closing prices for the market for the past 18 days, then divide the sum by 18. Suppose you're creating an 18-day moving average over a multiple-month period. In that case, you'll wind up with a significant amount of data points plotted on a chart, each showing the average of the previous 18 days of prices.
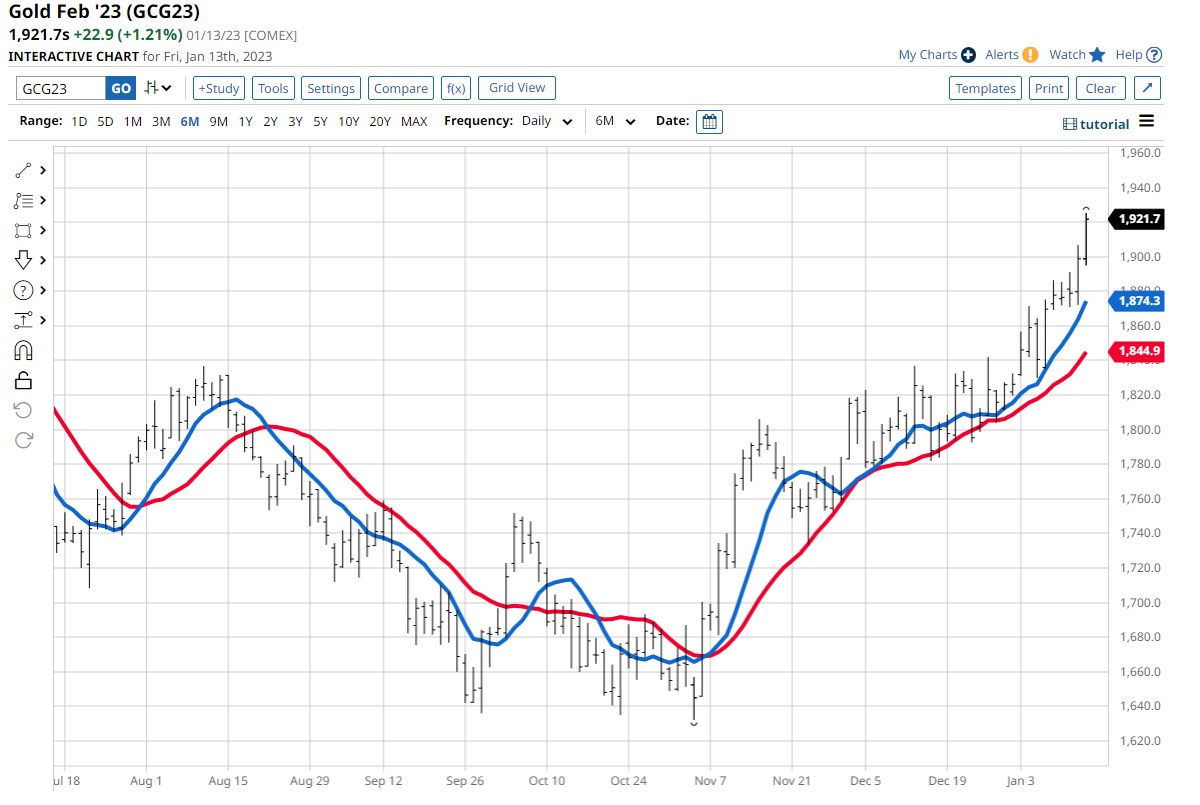
The above gold chart illustrates an 18-day (red line) moving average and a 9-day (blue line) moving average over six months. During this period, there were multiple random closing prices each day. The moving averages illustrate the market's direction better than random daily prices.
Using multiple moving averages, traders would determine the trend by the proximity of the shorter-term (9-day) moving average to the longer-term (18-day) moving average. If the 9-day moving average exceeds the 18-day moving average, the trend is presumed to be up. If the 9-day moving average is less than the 18-day moving average, the trend is thought to be down.
Different Types of Moving Averages
Traders generally default to the simple moving average (SMA). The term simple moving average evolved because each data point is weighted equally in the calculation. There is no one superior moving average length.
Generally speaking, the length of the SMA is related to a popular period. For example, a 20-day moving average represents one month of trading, a 5-day moving average may denote one week of trading, and 10 days might relate to two weeks of trading. The popular 200-day characterizes one year of trading. Each of these periods would represent a trend for that period.
The exponential moving average (EMA) is similar to the SMA in that it still averages random data periods over time. But, it weights the series of data points to the more recent prices instead of equally weighting each period like an SMA. Due to the weighting, the moving averages become more sensitive to the most recent price history.
As with most analysis techniques, SMAs and EMAs have a lagging effect on analysis because they are both calculated from historical data. Using lagging analysis techniques only means a trader will not be selling the exact high or low of a price move. Moving averages keep traders on the right side of the balance sheet by trading in the trend direction, not trying to pick the tops and bottoms of market moves.
Traders should respect moving average trend analysis for what it is intended for-direction, not where to enter or exit a market. We will discuss some tips for finding these locations next.
Now that the Moving Averages Have Found the Trend, Now What?
Due to the lagging nature of moving averages, the price has made a significant move by the time the shorter-term moving average crosses the longer-term moving average. At this point, a trader might wait for a price retracement to enter the market.
Some traders use moving averages as support/resistance levels. Since there are so many lengths of moving averages available, it would be challenging to find an optimum moving average to enter a trade for consistent profitable results.
To avoid chasing prices higher or lower after a moving average crossover, a trader could look for better opportunities as prices correct the strong move it took to cross over the moving averages.
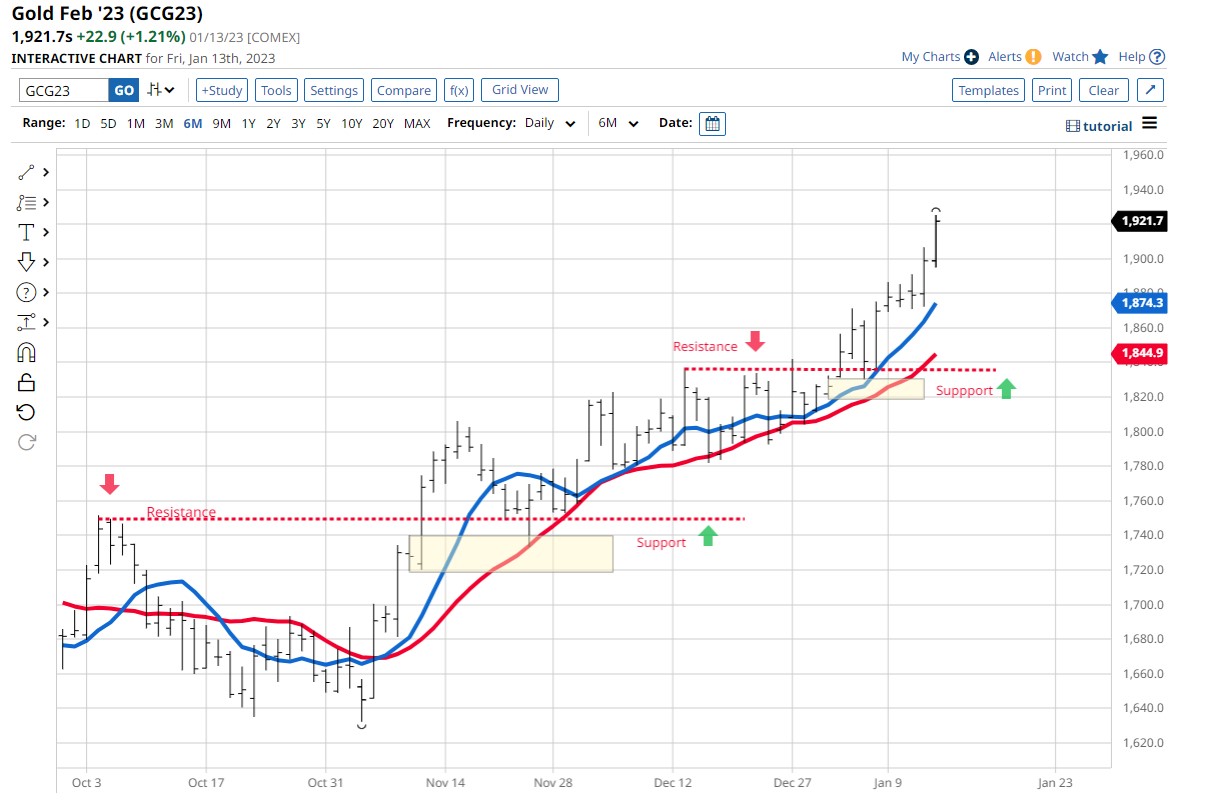
The above gold chart identifies two locations for finding a trade entry location after the price has corrected towards the two means (SMAs).
We know the market was in an uptrend for both of these setups because the short-term SMA (blue line) was above the long-term SMA (red line).
A trendy trade setup is when resistance is broken, which becomes support when the price returns to it. Or when support is broken, it then becomes resistance when the price returns to it.
The gold chart illustrates the first broken resistance (left side of the chart) and shows the price, returning to what has now become a support area (red dotted line). Traders will see this pattern occur frequently. The price does not need to touch the SMA's, but the closer to its average price the retracement gets, the better the odds. The trend must stay up while the price retraces.
Before the price broke the last resistance line, a consolidation pattern developed (yellow box); entering the trade in this area when the price returns will give the trader a logical entry point. When the price broke the resistance, some traders went long, chasing the market. Often, this is called "the fear of missing out" (FOMO). Most of these FOMO traders are now being stopped as the price returns to a support area.
The second trade setup (right side of the chart) has a similar sequence of events leading to another support area developing in an uptrend. The consolidation areas do not have to form in the same timeframe as the trend. Explore different timeframes to find an optimal consolidation pattern.
Summary
Identifying the trend may reward the trader with higher probability trades. The trend moves in the path of least resistance, allowing the trader to go with the flow of the price action instead of fighting it.
Only one possible trade entry technique was discussed in this article, but there are many more possibilities. Continue studying the markets and finding your optimal entry setups in the context of the trend.
Other articles that I have written that may help you find trades more in your favor are:
- Human Habits Lead to Tradable Seasonal Patterns
- A Commitment of Traders' Report With More Transparency
More Metals News from Barchart
- Dollar Under Pressure as Stocks Rally and Yen Strengthens
- Stocks Fluctuate as We Head Into a 3-Day Weekend
- Dollar Drops on Slower U.S. Inflation and a Rally in Stocks
- Stocks Rally After As-Expected CPI Report
On the date of publication, Don Dawson did not have (either directly or indirectly) positions in any of the securities mentioned in this article. All information and data in this article is solely for informational purposes. For more information please view the Barchart Disclosure Policy here.
/Amazon_com%20Inc_%20%20package%20by%20-%20AdrianHancu%20via%20iStock.jpg)

/Salesforce%20Inc%20HQ%20building-by%20JHVEPhoto%20via%20Shutterstock.jpg)
/Dell%20Technologies%20by%20Poetra_RH%20via%20Shutterstock.jpg)
/Intel%20Corp_%20Santa%20Clara%20campus-by%20jejim%20via%20Shutterstock.jpg)