Nearest / Continue Intervals
When creating a chart for a commodity or futures symbol, you will see options to use a "Nearest" or "Continue" interval when defining the chart's Time Interval (Daily Continue, Weekly Nearest, etc.)
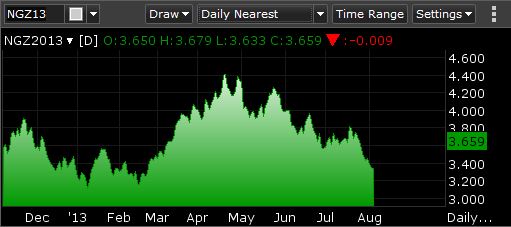
Nearest Definition
When selecting a "Nearest" chart interval, a historical chart is built using the nearest contract. The nearest contract is the closest unexpired contract for the underlying commodity, where every chart bar represents the front month at that point in history.
Example of a Daily Nearest Chart:
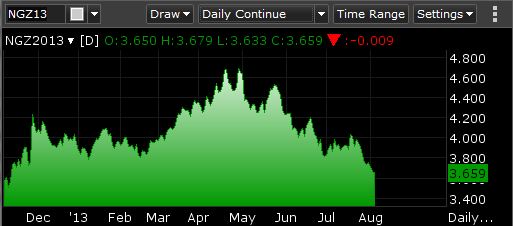
Continue Definition
When selecting a "Continue" chart interval, a historical chart is built using the same month specified for the original contract. For example, if the symbol is ZSX13 (Soybeans November 2013), the chart is built using all previous November contracts for Soybeans (ZSX13, ZSX12, ZSX11, ZSX10 etc).
Example 2: This is the same chart as above, using Daily Continue vs. Daily Nearest.