Grain Price and Basis Indexes

Best-in-class intraday and historical data delivering precise, transparent price indicators for Corn, Soybeans, and Wheat. Our comprehensive dataset—integrating extensive historical data with real-time streaming updates—empowers trading strategies with accurate, actionable market insights.
Explore DataLeading Alternative Data
Our indicator methodology uses a transparent weighting process, incorporating price, capacity, and throughput to deliver objective prices that accurately reflect market dynamics.
Comprehensive Indexing
We calculate continuous and end-of-day price and basis levels for individual Counties up to our benchmark National Index – historical data is available from 2014.
Seamless Integration
Grain Price & Basis Indexes integrate effortlessly into applications, websites, or workflows with flexible delivery options, including APIs, high-performance streaming feeds, and cmdtyView.
Barchart’s Commodity Grain Price Benchmarks
| Price Index | Symbol | Value | Day Change | % Change | Date |
|---|---|---|---|---|---|
| US Corn Price Idx | ZCPAUS.CM | 4.101 | -0.061 | -1.46% | 07/31/26 |
| US Soybean Price Idx | ZSPAUS.CM | 11.413 | -0.074 | -0.65% | 07/31/26 |
| Iowa Corn Price Idx | ZCPAIA.CM | 4.098 | -0.040 | -0.97% | 07/31/26 |
| Illinois Corn Price Idx | ZCPAIL.CM | 4.277 | -0.047 | -1.08% | 07/31/26 |
| Illinois Soybean Price Idx | ZSPAIL.CM | 11.603 | -0.083 | -0.71% | 07/31/26 |
| Iowa Soybean Price Idx | ZSPAIA.CM | 11.498 | -0.007 | -0.06% | 07/31/26 |
Barchart’s Commodity Indexes is the authority for grain bids and price assessments
Our methodology uses a sophisticated - but transparent - weighting process to ensure the commodity prices we generate reflect underlying market economics. By combining price with capacity and throughput, Barchart’s Commodity Indexes is the only source for grain pricing that isn’t just “average.”
Methodology
Download PDFFactsheet
Download PDFSymbology
Download PDFFIPS Code Lookup
Download CSVSubscribe to Grain Price and Basis Indexes
Explore Our DataIn the Barchart Commodities blog More
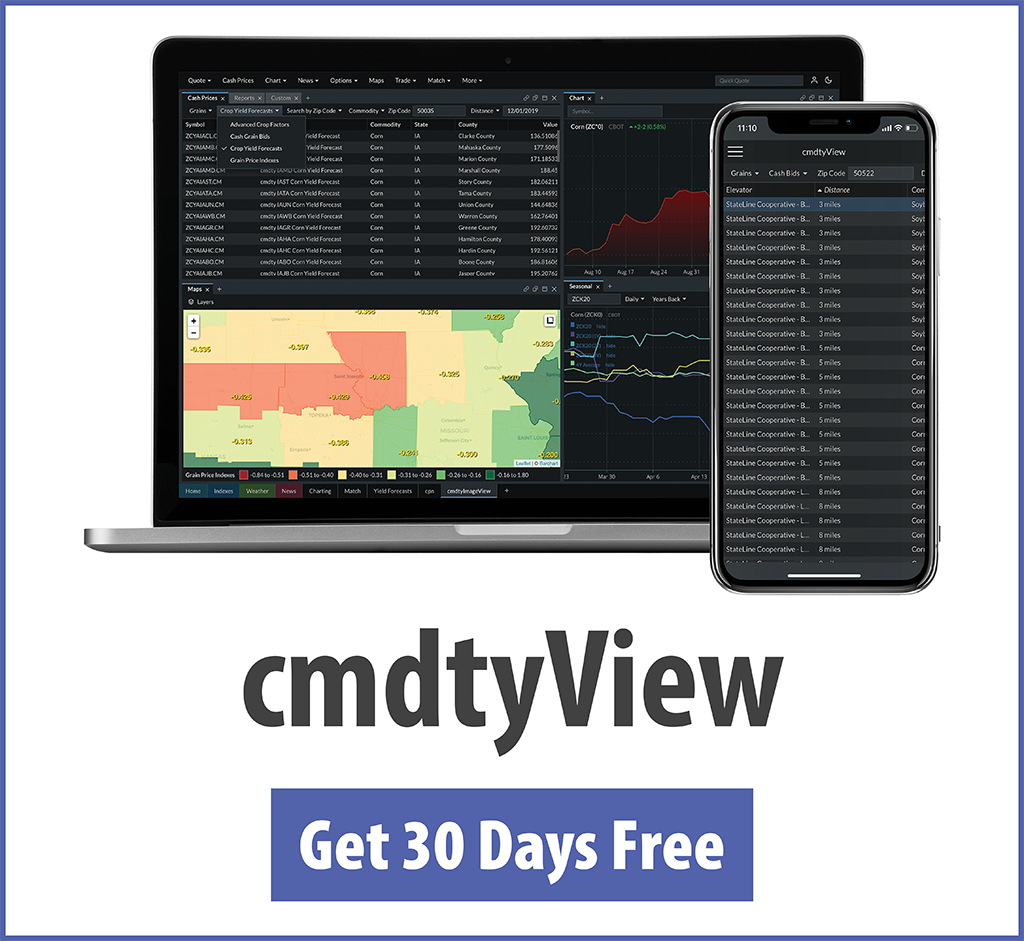
cmdtyView®
Get all of our commodity data and prices in cmdtyView®
All of our exclusive data and prices are available through the cmdtyView® terminal – a fully web-based and responsive commodity trading platform that works seamlessly across all of your devices.
Start Free Trial ›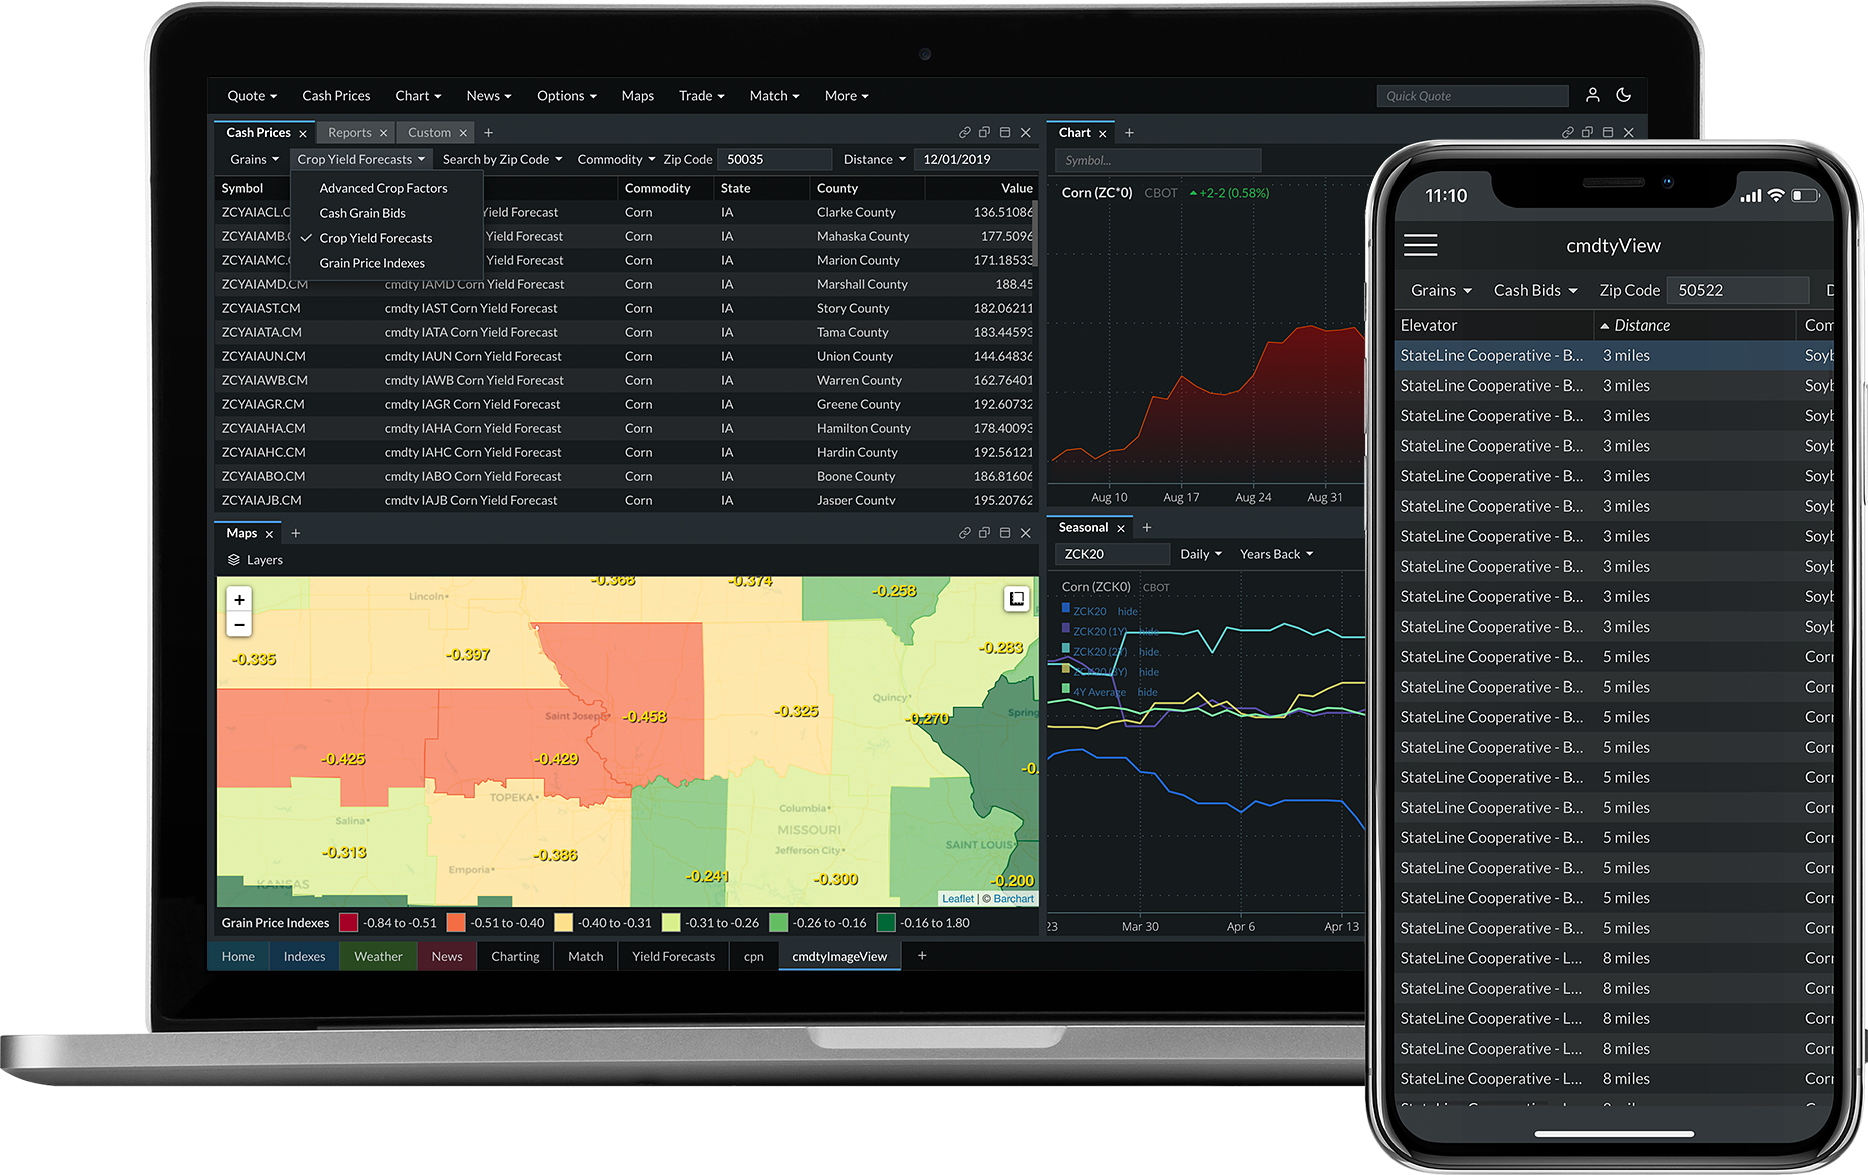
Explore Barchart’s Commodity Pricing Network
Access data from the leading contributors in Ag and Energy. Available over API or through cmdtyView.
Free Commodity Reports
Get access to our proprietary price reports to keep a pulse on global commodity markets.