United States of America Soybeans Production
Area: United States of America
Source: USDA
Simple to use aggregated data available over API

- Supply & Demand
- Production & Consumption
- Imports & Exports
- Grain stocks, acres planted, and harvested
- Stocks and Inventories
Seamless integration into your team’s workflow

- Data available over API, cmdtyView or cmdtyView for Excel
- Subscription packages available for teams down to single users
- Increase the efficiency with which your team collects information
- Let us onboard and manage complex data sets for you as a managed service
Subscribe to cmdtyStats API
Explore Our DatacmdtyView®
Get all of our commodity data and prices in cmdtyView®
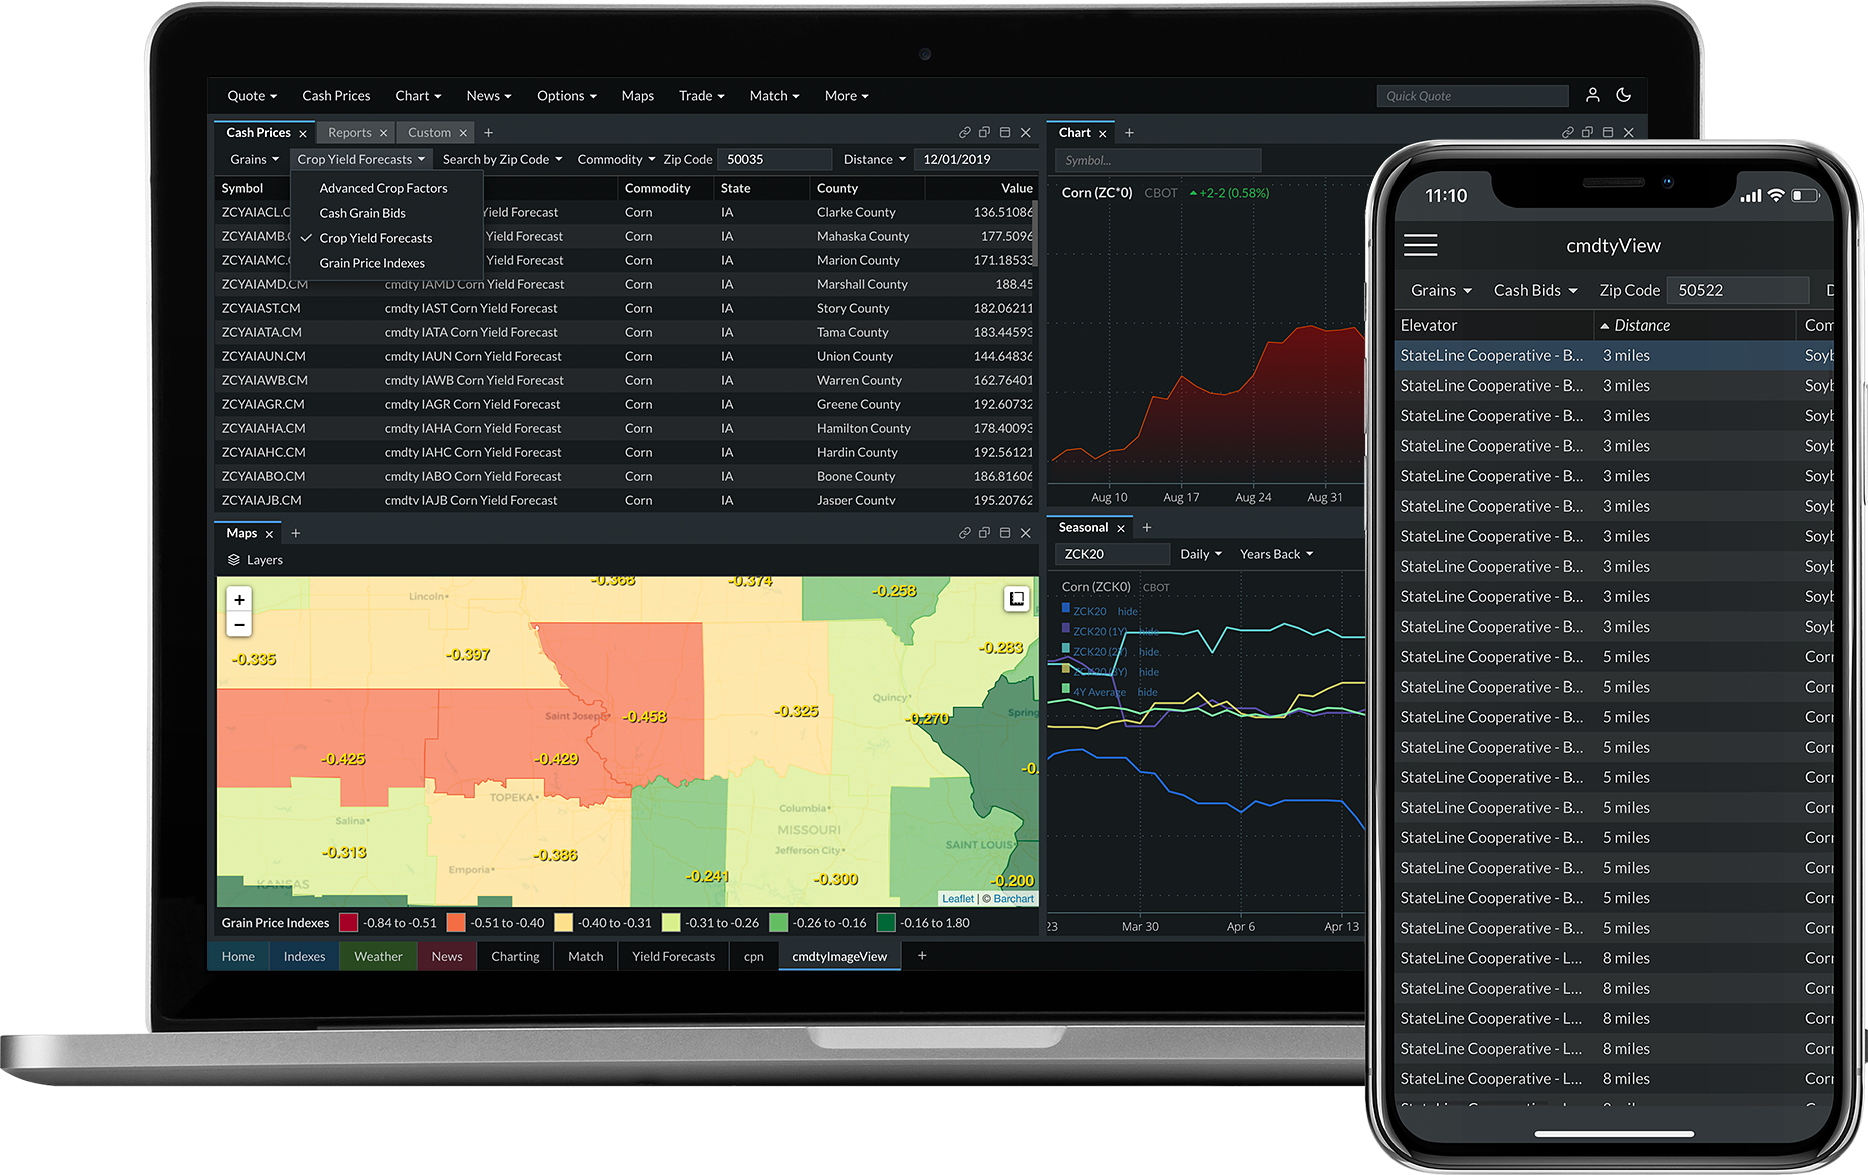
All of our exclusive data and prices are available through the cmdtyView® terminal – a fully web-based and responsive commodity trading platform that works seamlessly across all of your devices.
Start Free Trial ›
Overview
| Most Recent Value | 4,164,677,000 |
|---|---|
| Most Recent Date | 12-31-2023 |
| Frequency | Annual |
| Unit | Bushel |
| Multiplier | 1 |
| Prior Value | 4,270,381,000 |
| Prior Value Date | 12-31-2022 |
| First Value | 4,947,000 |
| First Value Date | 12-31-1924 |
Historical Data
| 12-31-2023 | 4,164,677,000 |
|---|---|
| 12-31-2022 | 4,270,381,000 |
| 12-31-2021 | 4,464,492,000 |
| 12-31-2020 | 4,216,302,000 |
| 12-31-2019 | 3,551,908,000 |
| 12-31-2018 | 4,428,150,000 |
| 12-31-2017 | 4,411,633,000 |
