Blog
Feb 7 2020
Webinar Recap | Powerful Charts to Engage your Users

Barchart’s HTML5 Charting Library provides firms with a powerful, yet developer-friendly, toolkit that can be easily integrated across platforms. In our latest webinar, our Charting Experts Mark Wator and Bill Karabetsos showcased how modern media firms can use these charts in order to better engage their users and create a sales funnel. If you missed it, you’re in luck because we’re recapping the webinar for you here…let’s dive in.
Why is Charting Important When it Comes to Engaging Users?
In January, we released a Stock Market Survey to find out what is driving retail investors in 2020. In order to do this, we surveyed 400 investors across LinkedIn (Business Professional Audience), Facebook (General Online Audience), and Barchart.com (Active Investor Audience).
In conducting this survey we found that the main tools driving retail investors include financial news, watchlists, portfolios, and most importantly charts. With this conclusion, you can see that having a premium desktop experience for charting is key when it comes to engaging active investors.
Implementing our Charting Library…
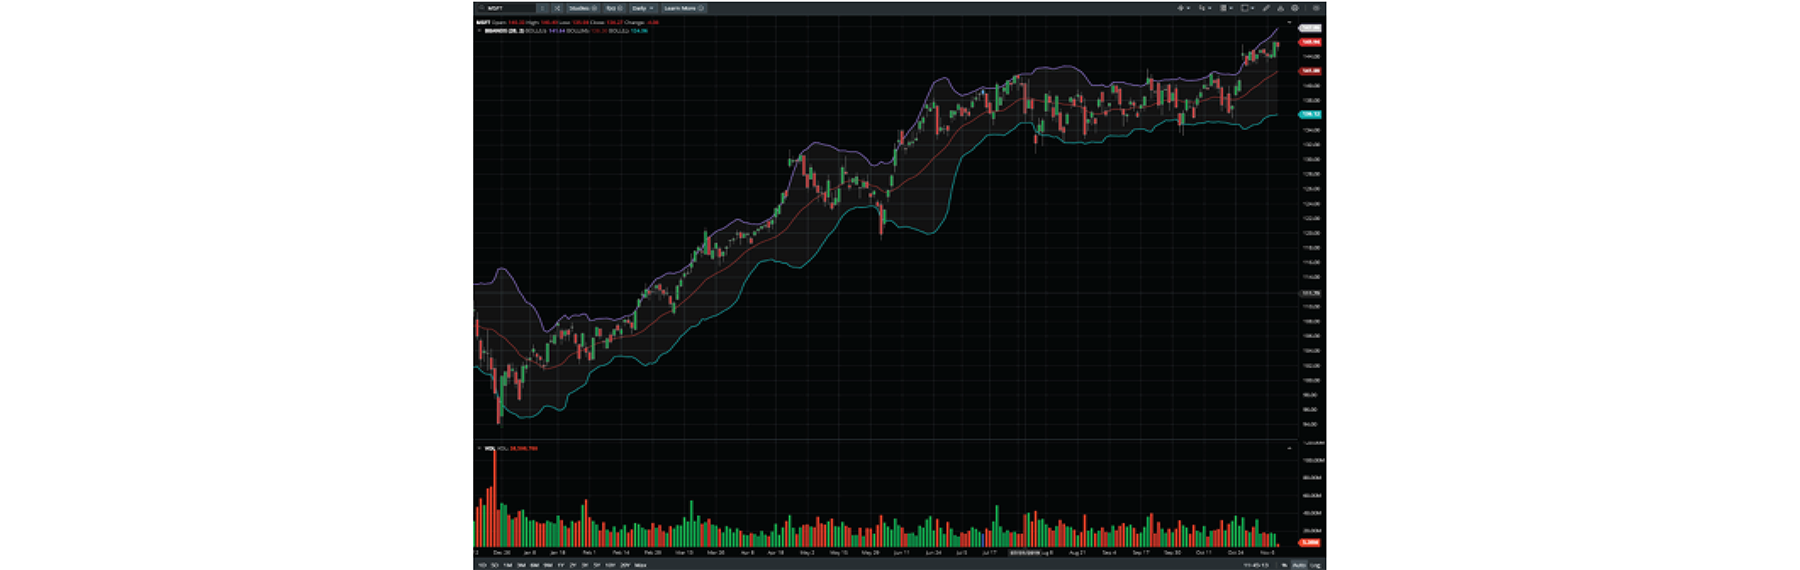
Our Charting Library was built from the ground up in plain vanilla JavaScript, which means there is no framework required - but it is compatible with all popular frameworks, if you prefer to use one. This library is 100% API-based, meaning anything stylistic or any technical indicators can be easily customized. It is also open and agnostic, so it supports the entire Barchart Data Ecosystem, along with supporting virtually any third-party data feed.
Firms can easily rebrand our Charting Library with a private label in order for it to fit their exact needs. We even use this Charting Library across our own platforms, from our financial portal Barchart.com, to our flagship commodity trading platform, cmdtyView.
With a private label our Charting Library, the possibilities are endless. These possibilities include full control over the look and feel in order to match your product, events overlay so you can inject your own proprietary content, the ability to save and export user customized charts, the support of all modern-day browsers, and the ability to scale from basic to fully featured integrations.
We built this best-in-class Charting Library in order to provide clients with powerful charting to better engage their customers, so our Charting Library is packed-full of useful tools and capabilities.
Some of these features include:
- Over 100 studies
- 11 different plot types and 35 different annotations
- Support of any interval (tick, intra-day, end-of-day, etc.)
- Support of any date range (1 day, 5 day, etc.)
- Seasonal and Forward Curve support
- Ability to import custom studies and indicators

How Can This Create a Sales Funnel?
Our Charting injects interactive content throughout your entire suite of products, actively engaging your users along the way. But how do you monetize these powerful charts?
With our Charting Library, you have total control. For example, you may want to create tiered content. You could display introductory charts that any user can view, but to access the premium content, it could require a premium login. Another way to monetize, could be through the ability to save charts, limiting the amount of charts users are able to save,and pushing them into the sales funnel.
You can also integrate additional features. Tools like watchlists and portfolios allow users to store data within your ecosystem, and they’ll want to return to your site to reference that data. Adding alerts can act in the same way because it prompts users to return to your site to see why a price movement happened.

Building Better Products with Better Charts
Whether you bring your own data, or decide to get to market faster with Barchart’s, our modern, fully customizable Charting Library will help you build better products to better engage with your customers. If you’re interested in learning more about our Charting Library please contact us at solutions@barchart.com. To demo Barchart’s interactive Charting Library, please click here.
To watch the full webinar, please fill out our form.