SOJA ROS Jul '26 (D8N26)
[[ item.lastPrice ]] [[ item.priceChange ]] ([[ item.percentChange ]]) [[ item.tradeTime ]] [MATBA]
[[ item.bidPrice ]] x [[ item.bidSize ]] [[ item.askPrice ]] x [[ item.askSize ]]
for [[ item.sessionDateDisplayLong ]]
Find the latest SOJA ROS prices and SOJA ROS futures quotes for all active contracts below.
[[ timeframe ]] futures price quotes as of Wed, Jun 10th, 2026.
Latest price quotes as of [[ snapshotDate ]].
[[ timeframe ]] futures price quotes, based on [[ timeframe ]] data.
Looking for expired contracts? Check out our SOJA ROS Historical Prices page.

June WASDE Preview: What the Trade Expects Thursday
The trade sees U.S. stocks near USDA's May marks — but expects South American production to climb. Here's the breakdown.
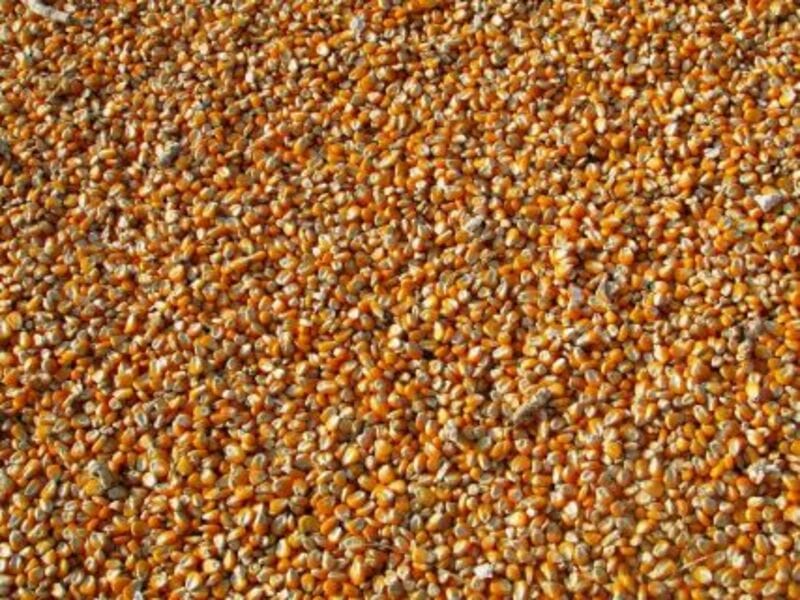
Corn Showing Early Wednesday Strength
Corn prices are up 3 to 5 cents so far on Wednesday morning. Futures fell back off midday gains on Tuesday, with contracts steady to 1 ½ cents lower,...

Wheat Showing Early Wednesday Gains
Wheat is higher across most contracts so far on Tuesday Wednesday. The wheat complex posted mixed action on Tuesday. Chicago SRW were up ½ to 2 cents...
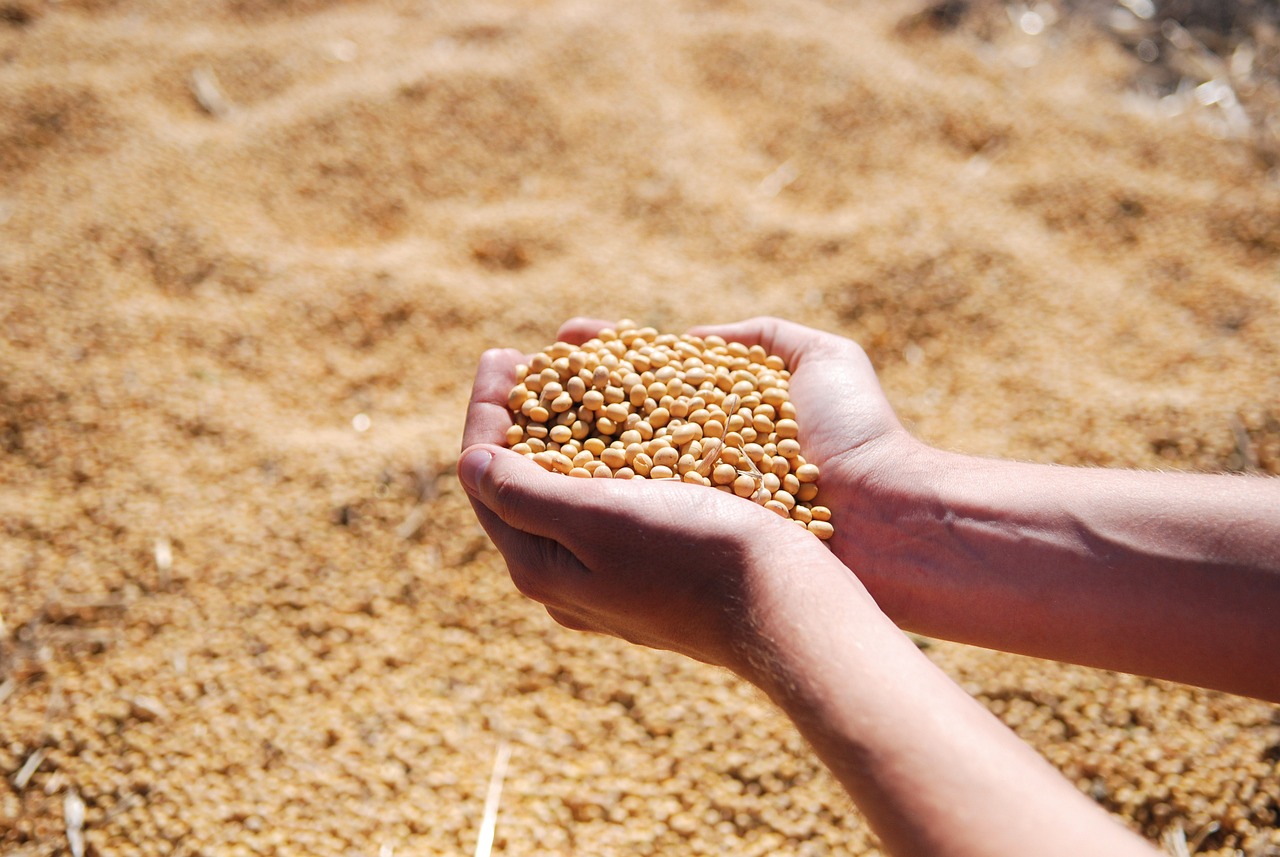
Soybeans Bouncing on Wednesday Morning
Soybeans are trading with 5 to 7 cent gains early on Wednesday. Futures were weaker on Tuesday, with contracts closing fractionally to 4 ¾ cents lower....
Grains Firm Up Ahead of Tomorrow's WASDE. Get the Preview!
Corn pushes toward resistance, beans steady, wheat rebounds—will the strength stick through the session?

Is Xylem Stock Underperforming the Dow?
Xylem has underperformed the Dow over the past year, but analysts are cautiously optimistic about the stock’s prospects.
Is DuPont de Nemours Stock Outperforming the Nasdaq?
DuPont de Nemours has outperformed the Nasdaq over the past year, and analysts are highly optimistic about the stock’s prospects.

Is GE HealthCare Stock Underperforming the S&P 500?
Despite GE HealthCare's underperformance relative to the S&P 500 Index over the past year, analysts are moderately optimistic about the stock’s prospects....

Is Vistra Stock Underperforming the S&P 500?
Vistra has underperformed the S&P 500 over the past year, but analysts are highly optimistic about the stock’s prospects.

Cotton Back to Posting Wednesday Gains
Cotton trading with early Wednesday gains of 23 to 71 points. Futures posted losses of 143 to 231 across most contracts on Tuesday. The outside factors...
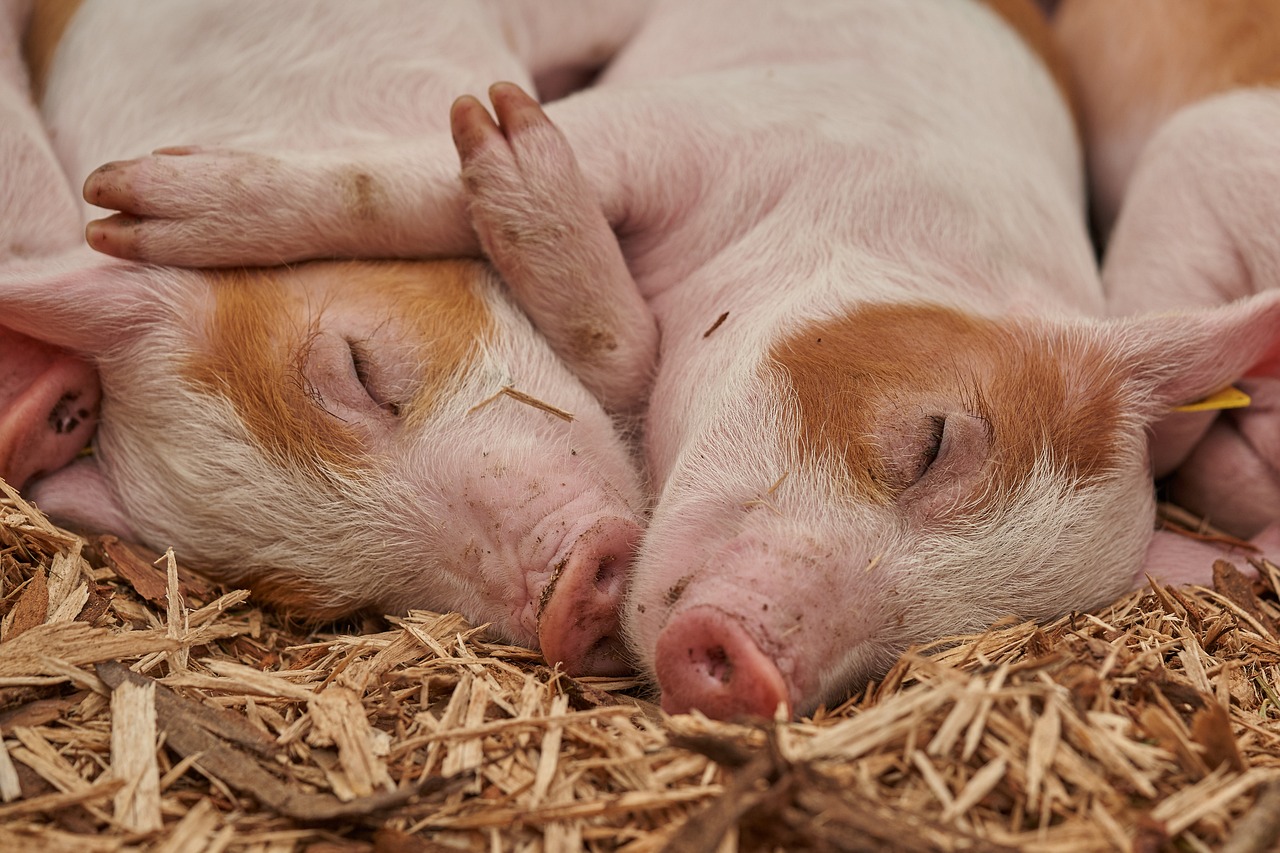
Hogs Look to Wednesday Traders
Lean hog futures posted losses of 45 cents to $1.45 on Tuesday. Open interest suggested a rotation of ownership, up just 40 contracts. USDA’s national...
Corn Showing Early Wednesday Strength
Corn prices are up 3 to 5 cents so far on Wednesday morning. Futures fell back off midday gains on Tuesday, with contracts steady to 1 ½ cents lower,...

Cattle Look to Wednesday Trade Following Tuesday Gains
Live cattle futures saw gains of $1.50 to $2.97 most contracts on Tuesday. There were no deliveries issued on Tuesday, with the oldest long dated August...