30-Year T-Bond Sep '26 (ZBU26)
[[ item.lastPrice ]] [[ item.priceChange ]] ([[ item.percentChange ]]) [[ item.tradeTime ]] [CBOT]
[[ item.bidPrice ]] x [[ item.bidSize ]] [[ item.askPrice ]] x [[ item.askSize ]]
for [[ item.sessionDateDisplayLong ]]
Find the latest 30-Year T-Bond prices and 30-Year T-Bond futures quotes for all active contracts below.
[[ timeframe ]] futures price quotes as of Thu, Jun 18th, 2026.
Latest price quotes as of [[ snapshotDate ]].
[[ timeframe ]] futures price quotes, based on [[ timeframe ]] data.
Looking for expired contracts? Check out our 30-Year T-Bond Historical Prices page.

Stocks Sharply Higher as US-Iran Peace Deal Eases Inflation Risks
The S&P 500 Index ($SPX ) (SPY ) on Thursday closed up +1.08%, the Dow Jones Industrial Average ($DOWI ) (DIA ) closed up +0.14%, and the Nasdaq 100 Index...

Stocks Supported as Geopolitical Risks Recede
The S&P 500 Index ($SPX ) (SPY ) today is up +0.99%, the Dow Jones Industrial Average ($DOWI ) (DIA ) is up +0.61%, and the Nasdaq 100 Index ($IUXX ) (QQQ...

Stocks Rally as President Trump Signs a Preliminary Deal to End the US-Iran War
The S&P 500 Index ($SPX ) (SPY ) today is up +0.73%, the Dow Jones Industrial Average ($DOWI ) (DIA ) is up +0.53%, and the Nasdaq 100 Index ($IUXX ) (QQQ...

Stocks Rally Before the Open on U.S.-Iran Peace Deal
June S&P 500 E-Mini futures (ESM26) are up +0.98%, and June Nasdaq 100 E-Mini futures (NQM26) are up +1.64% this morning, pointing to a sharply higher...
Stocks Retreat as Fed Signals Possible Higher Interest Rates
The S&P 500 Index ($SPX ) (SPY ) on Wednesday closed down -1.21%, the Dow Jones Industrial Average ($DOWI ) (DIA ) closed down -0.98%, and the Nasdaq 100...

‘At Some Point, People Stop Trusting’: Billionaire Mark Cuban Says OpenAI CEO Sam Altman Is ‘All Over The Map’ And Warns ‘That Will Backfire on Him’
Mark Cuban sees some of his younger, brash, establishment-challenging self in Anthropic CEO Dario Amodei. But when it comes to OpenAI CEO Sam Altman, Cuban...

The Cows of Wrath: Here’s What Corn, Cattle, and Quantified Data Are Telling Us About a US Farm Crisis
Barchart experts Darin Newsom and William Osnato explain the facts behind the clickbait when it comes to what’s happening now and what’s next in major...
/The%20Rackspace%20Technology%20logo%20on%20a%20smartphone%20screen%20by%20Rafael%20Henrique%20via%20Adobe%20Stock.jpeg)
Cutting Jobs and Chasing AI: How to Play the Rackspace Stock Transformation Story Here
Rackspace technology has signed a deal with AMD while also announcing layoffs.

6 Simple Questions to Ask Yourself So You Can Survive (and Maybe Thrive) Even in a True Bear Market
To follow in my footsteps and proactively manage market risk, you’ll need to answer these core questions.
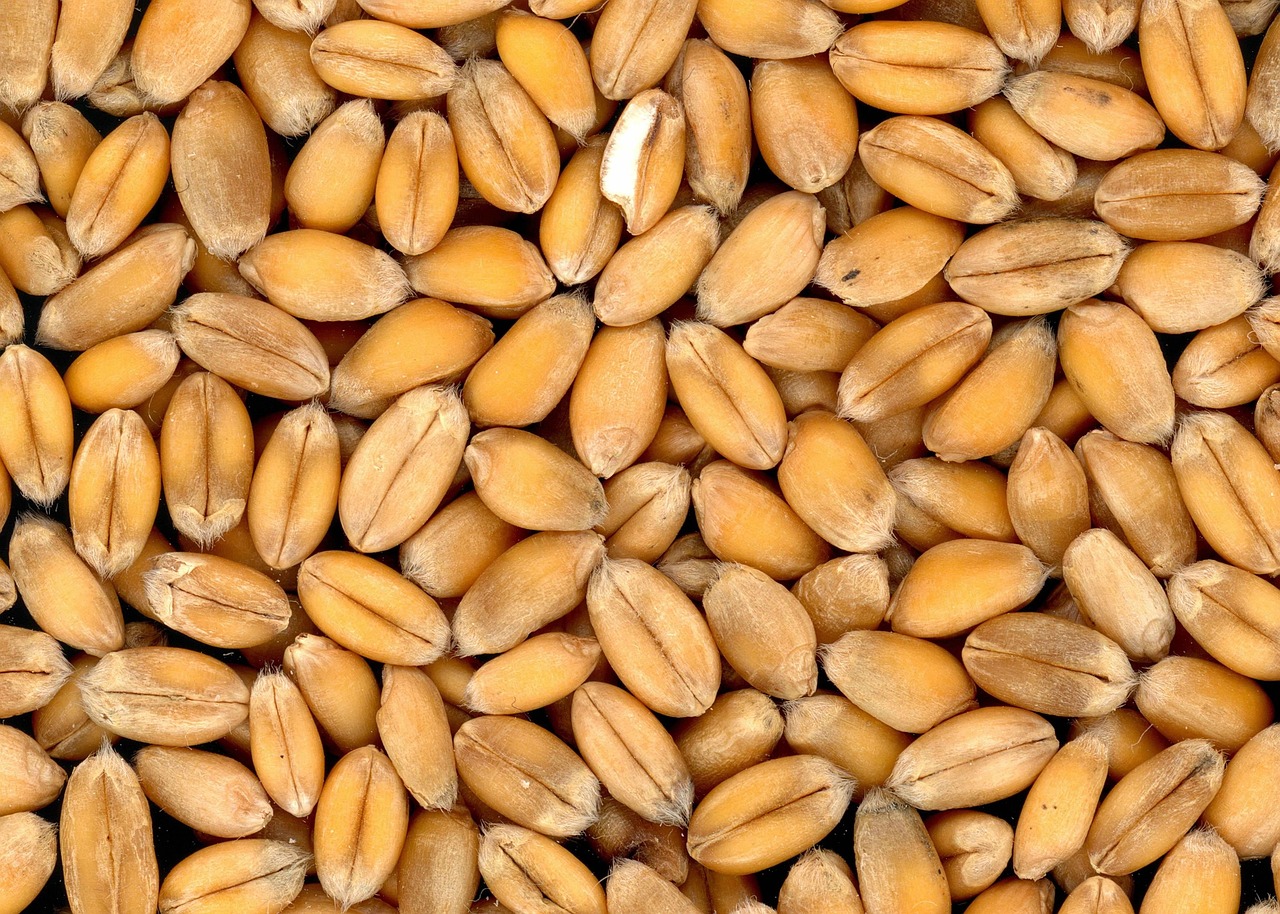
Wheat Slips Lower into the Week’s Close
The wheat complex fell back into the long weekend with losses across the three exchanges. Chicago SRW contracts were down 1 ½ to 7 ¼ cents at the close,...

Cotton Close Mostly Weaker Heading into the Long Weekend
Cotton futures posted 4 to 85 point losses in most contracts on Thursday, as July was still up 311 points this week. Crude oil was down another 17 cents/bbl...

Soybeans Retreat into the 3-Day Weekend
Soybeans posted losses of 6 ½ to 9 ¼ cents across the board on Thursday, with July holding for a 9 ¼ cent gain this week. The cmdtyView national average...
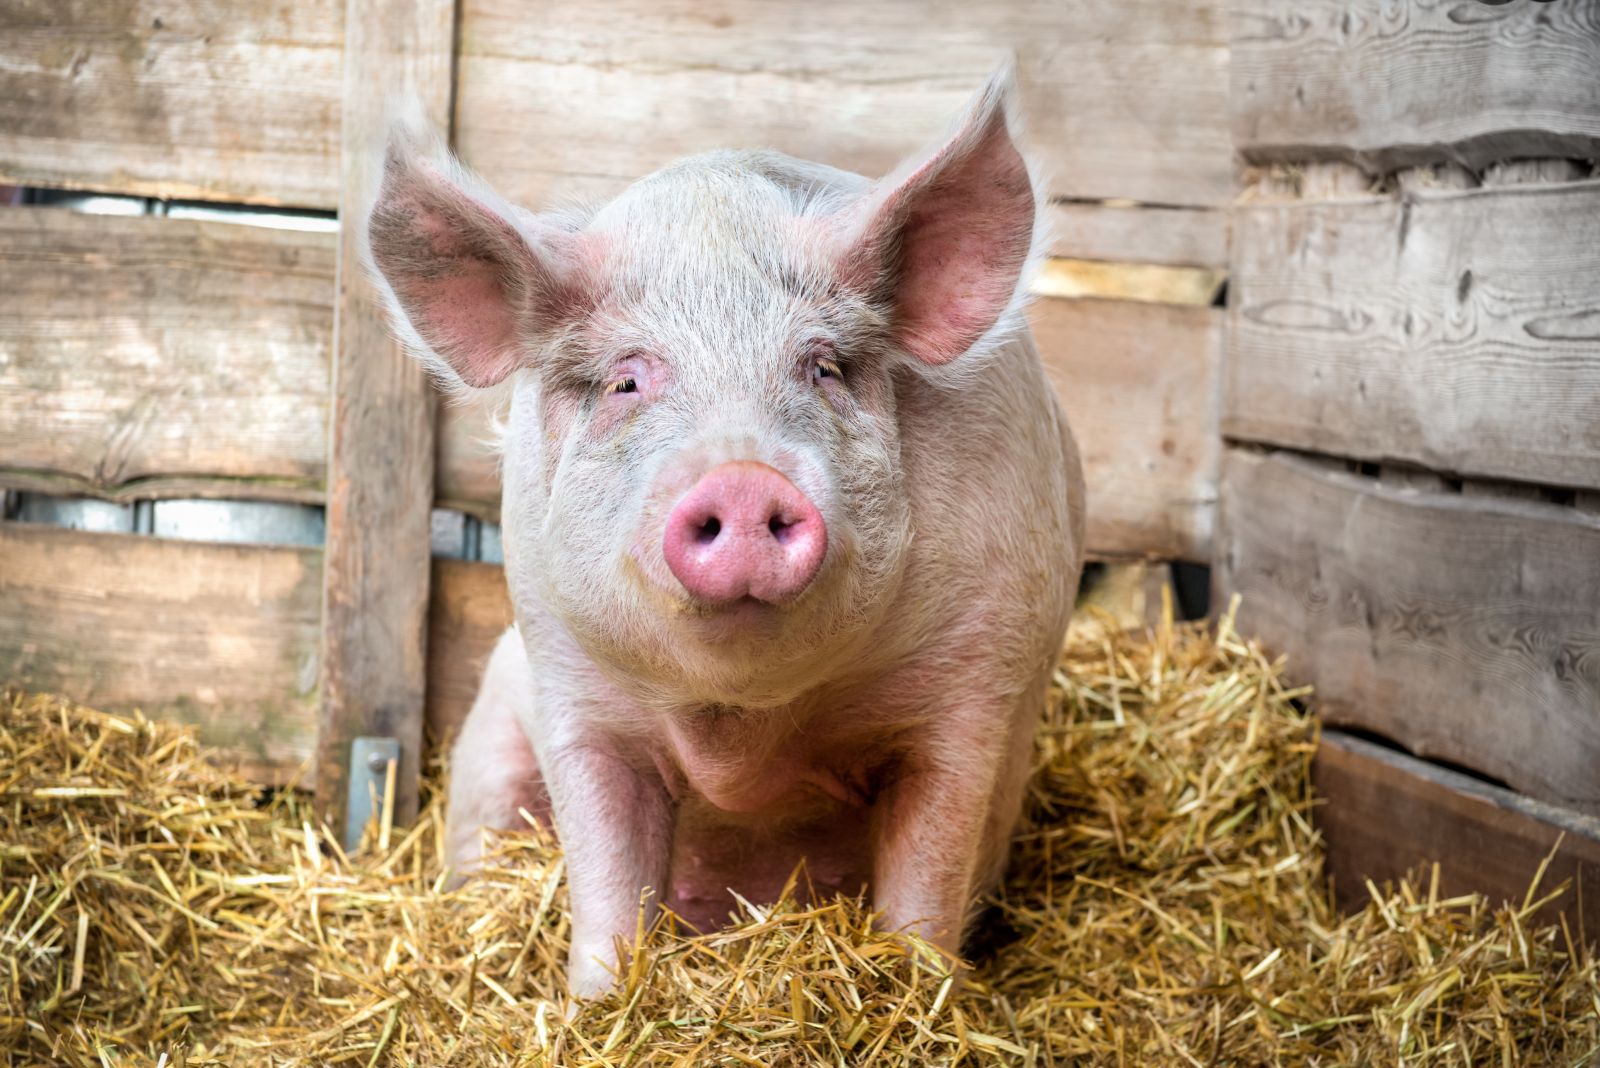
Hogs Post Mixed Trade to Close the Week
Lean hog futures were 5 to 27 cents higher in the front months on Thursday, with December and beyond, down 12 to 32 cents. July was still down $2.42 this...
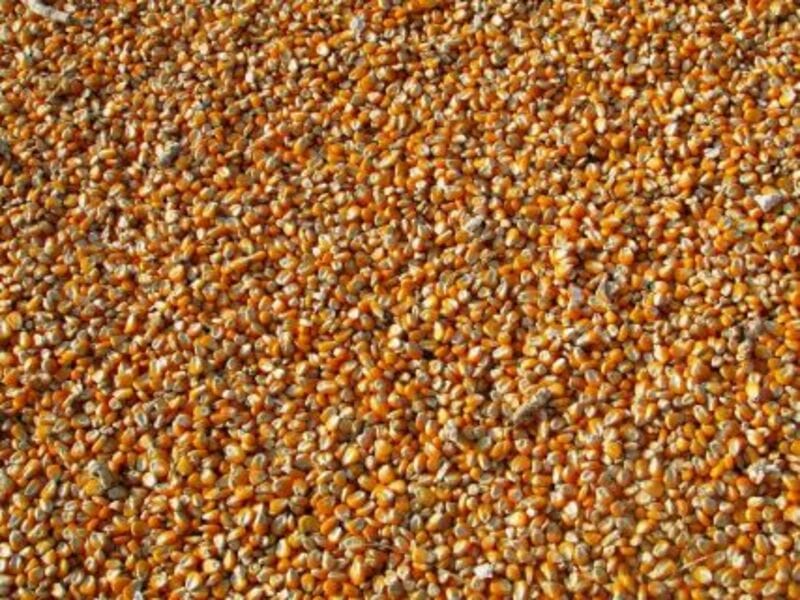
Corn Heads into the Long Weekend with Weakness
Corn futures posted losses of 3 ½ to 5 ¾ cents across most contracts on Thursday, with July holding onto a 4 ¾ cent gain. The CmdtyView national average...