[[ type === 'moc' ? 'MARKET ON CLOSE' : 'FREE WEBINAR' ]]
[[ timeLabel ]] WATCH LIVE:
Your browser of choice has not been tested for use with Barchart.com. If you have issues, please download one of the browsers listed here.
Stocks | Futures | Watchlist | News | More
or
Faster, Cleaner, Better.

ICE Soybean Oil Oct '14 (JLV14)

[[ item.lastPrice ]] [[ item.priceChange ]] ([[ item.percentChange ]]) [[ item.tradeTime ]] [ICE/US]
[[ item.bidPrice ]] x [[ item.bidSize ]] [[ item.askPrice ]] x [[ item.askSize ]]
[[ rootItem.symbol ]]underlying price [[ rootItem.lastPrice ]] [[ rootItem.priceChange ]] ([[ rootItem.percentChange ]]) [[ rootItem.tradeTime ]]
Quote Overview for [[ item.sessionDateDisplayLong ]]
[[ rowChartData.labelLow ]]
[[ rowChartData.lowPriceFormatted ]]
[[ rowChartData.lowPrice ]]
[[ rowChartData.labelHigh ]]
[[ rowChartData.highPriceFormatted ]]
[[ rowChartData.highPrice ]]
since [[ rowChartData.lowDate ]]
since [[ rowChartData.highDate ]]
[[ value ]] [[ value ]] ([[ financialData.relativeStrengthDirection14d ]]) ([[ financialData.highPercent1y ]]) ([[ financialData.lowPercent1y ]])

Contract Specifications

See More
Contract
N/A
Contract Size
N/A
Tick Size
N/A
Trading Hours
N/A
Exchange
ICE/US
Point Value
N/A

Seasonal Chart

ICE Soybean Oil Oct '14
Average Price Chart for 5 Prior Oct Contracts
Get Realtime - Quotes and Charts for Futures Traders. Learn More >>

Price Performance

See More
Period Period Low Period High Performance
1-Month
31.500 +4.10%
on 09/11/14
33.390 -1.80%
on 09/17/14
+0.780 (+2.44%)
since 08/29/14
3-Month
31.500 +4.10%
on 09/11/14
39.080 -16.10%
on 07/01/14
-7.430 (-18.47%)
since 06/27/14
52-Week
31.500 +4.10%
on 09/11/14
43.370 -24.39%
on 03/06/14
-9.900 (-23.19%)
since 09/27/13

More ICE Soybean Oil Quotes

All Futures Prices
Please wait...

Most Recent Stories

More News
WASDE Day! Here are the estimates and levels to watch

Grain futures markets have been choppy over the past 24-48 hours as traders gear up for another WASDE report. Will there be any new news to move the market?

Soybean Analysis: 2026 Market Volatility and Trend

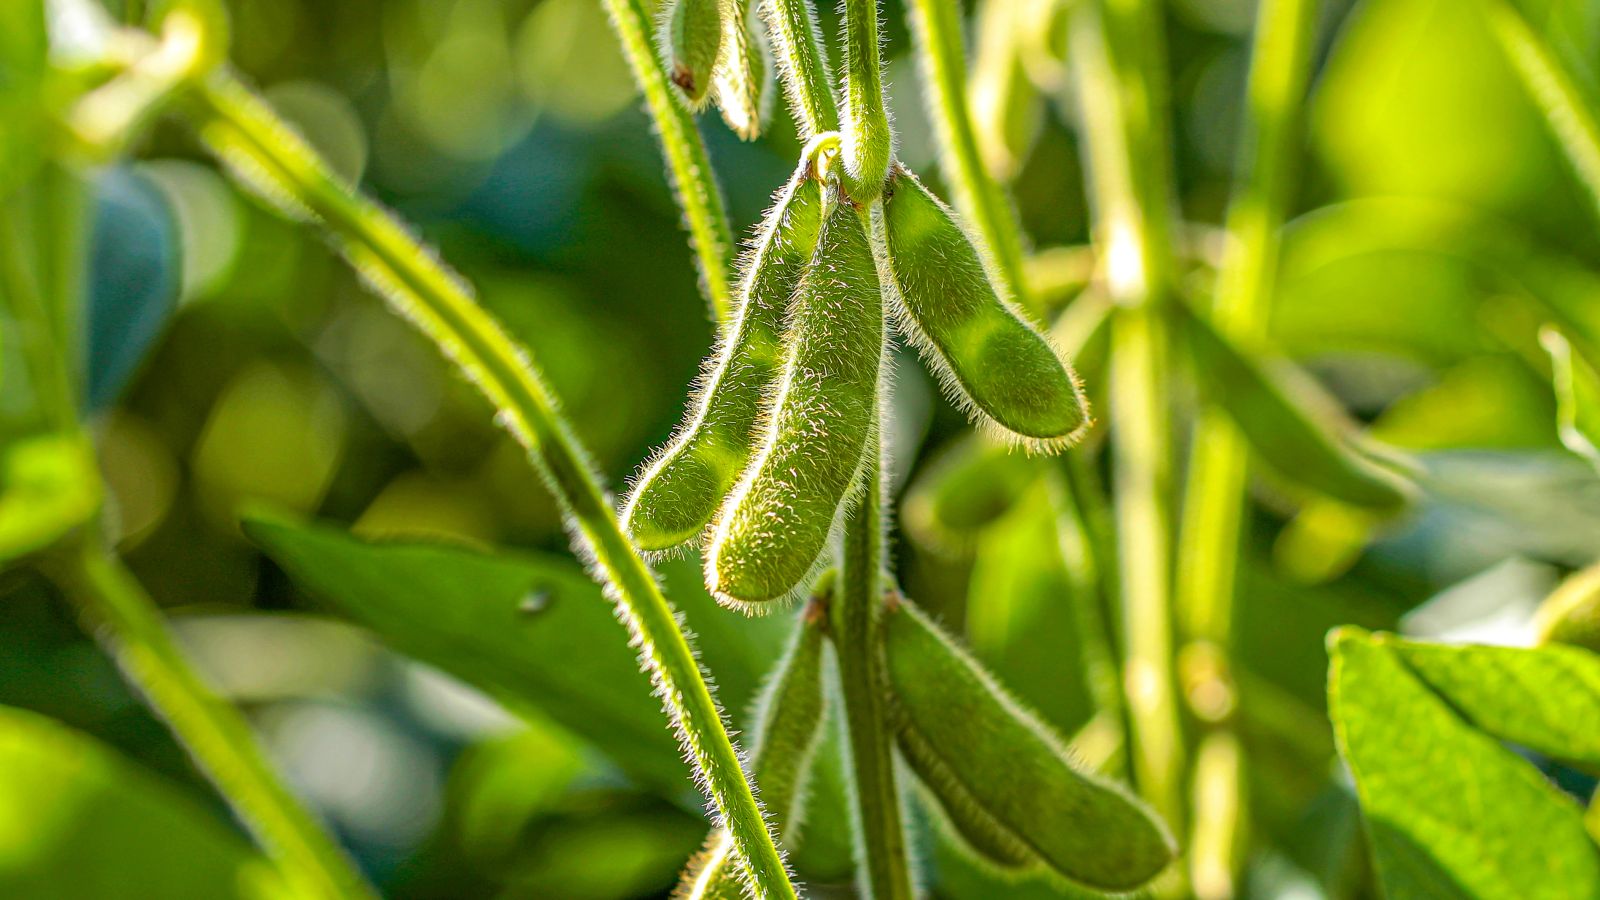
Examine the latest soybean chart structures and momentum indicators to identify why Prairie growers face mounting downside price risks.

ZSN26 : 1120-4 (-0.22%)
Soybeans Hold onto Wednesday’s Bounce into the Close

Soybeans posted gains of 4 to 9 ¼ cents across the board on Wednesday. The cmdtyView national average Cash Bean price was up 10 1/2 cents at $10.68 1/2. Soymeal futures were down $1.40 to $1 higher on...

ZSPAUS.CM : 10.6845 (+1.00%)
ZLN26 : 75.24 (-0.12%)
ZMN26 : 303.1 (+0.40%)
ZSPX26US.CM : 10.7169 (+0.61%)
ZSX26 : 1138-2 (-0.02%)
ZSN26 : 1120-4 (-0.22%)
ZSQ26 : 1125-6 (-0.18%)
Corn Slips Off the Highs into Wednesday’s Close

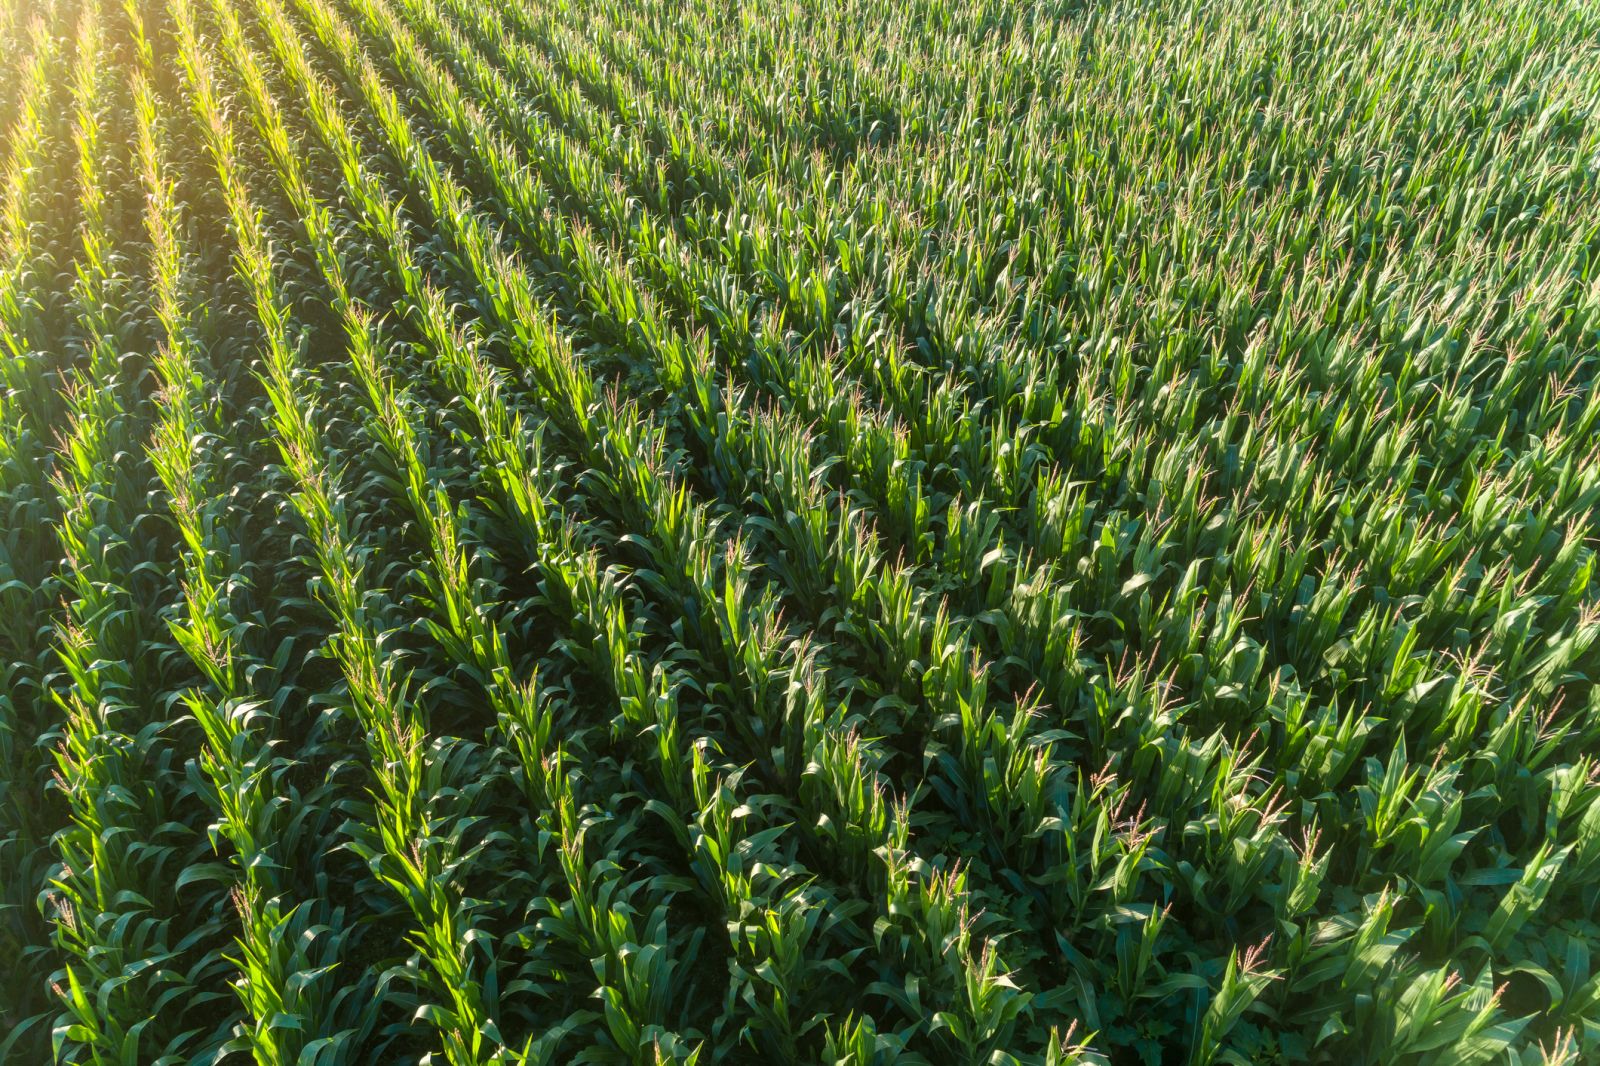
Corn futures slipped off the early gains on the Wednesday session, with July down ½ cent and other contracts fractionally to 2 1/4 cents higher. The CmdtyView national average Cash Corn price was steady...

ZCZ26 : 444-6 (-0.45%)
ZCU26 : 425-2 (-0.58%)
ZCN26 : 416-4 (-0.60%)
ZCPZ26US.CM : 4.1095 (+0.40%)
ZCPAUS.CM : 3.8393 (-0.59%)
Wheat Slips Off Early Highs on Wednesday

The wheat complex closed Wednesday mostly higher, but pulling off the highs late in the day. Chicago SRW closed with contracts up 2 ¼ to 4 ¾ cents across most months. KC HRW futures were steady to 5...

KEU26 : 636-2 (-0.62%)
KEN26 : 627-2 (-0.52%)
MWN26 : 6.1900 (+0.16%)
ZWN26 : 585-0 (-0.43%)
ZWU26 : 597-4 (-0.33%)
Grain Market Update: Are Corn, Wheat, and Soybeans Finally Carving Out a Summer Bottom?

Barchart Senior Market Analyst Darin Newsom analyzes whether the morning's short-covering bounce in grains is a temporary reprieve or a permanent bottom, while breaking down the technical realities of...

ZSN26 : 1120-4 (-0.22%)
LEM26 : 250.100s (+0.84%)
ZWN26 : 585-0 (-0.43%)
ZCN26 : 416-4 (-0.60%)
CLN26 : 89.22 (-0.90%)
Grain Markets Are Stuck — USDA Tomorrow Won't Move the Needle.  Here's What Will

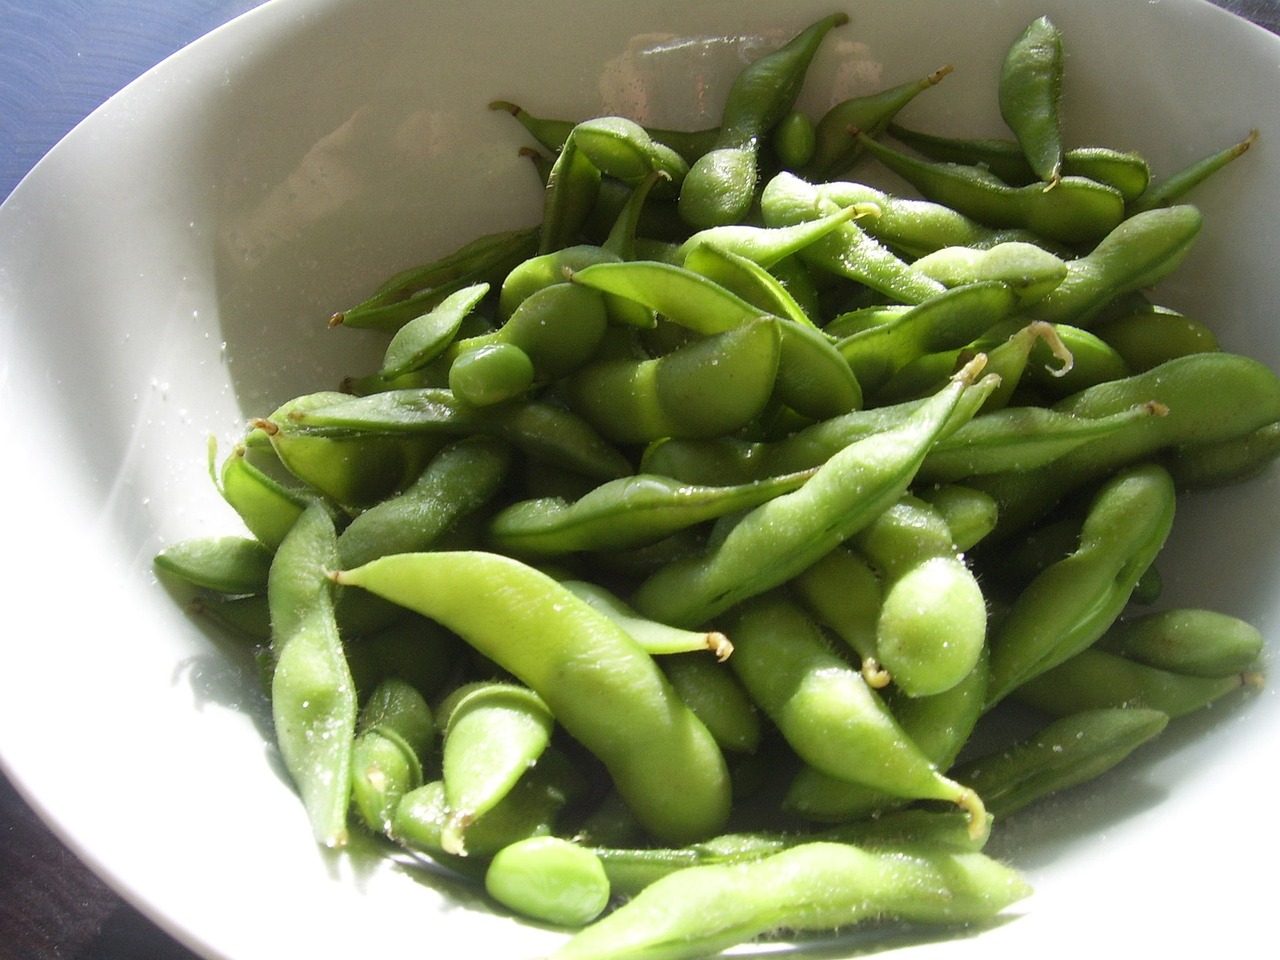
Soybeans just posted their first positive day in the last 9 trading sessions. A dead-cat bounce, or is the bottom in? That might depend on these catalysts

Shootin' the Bull about a lot of price expanse for little change

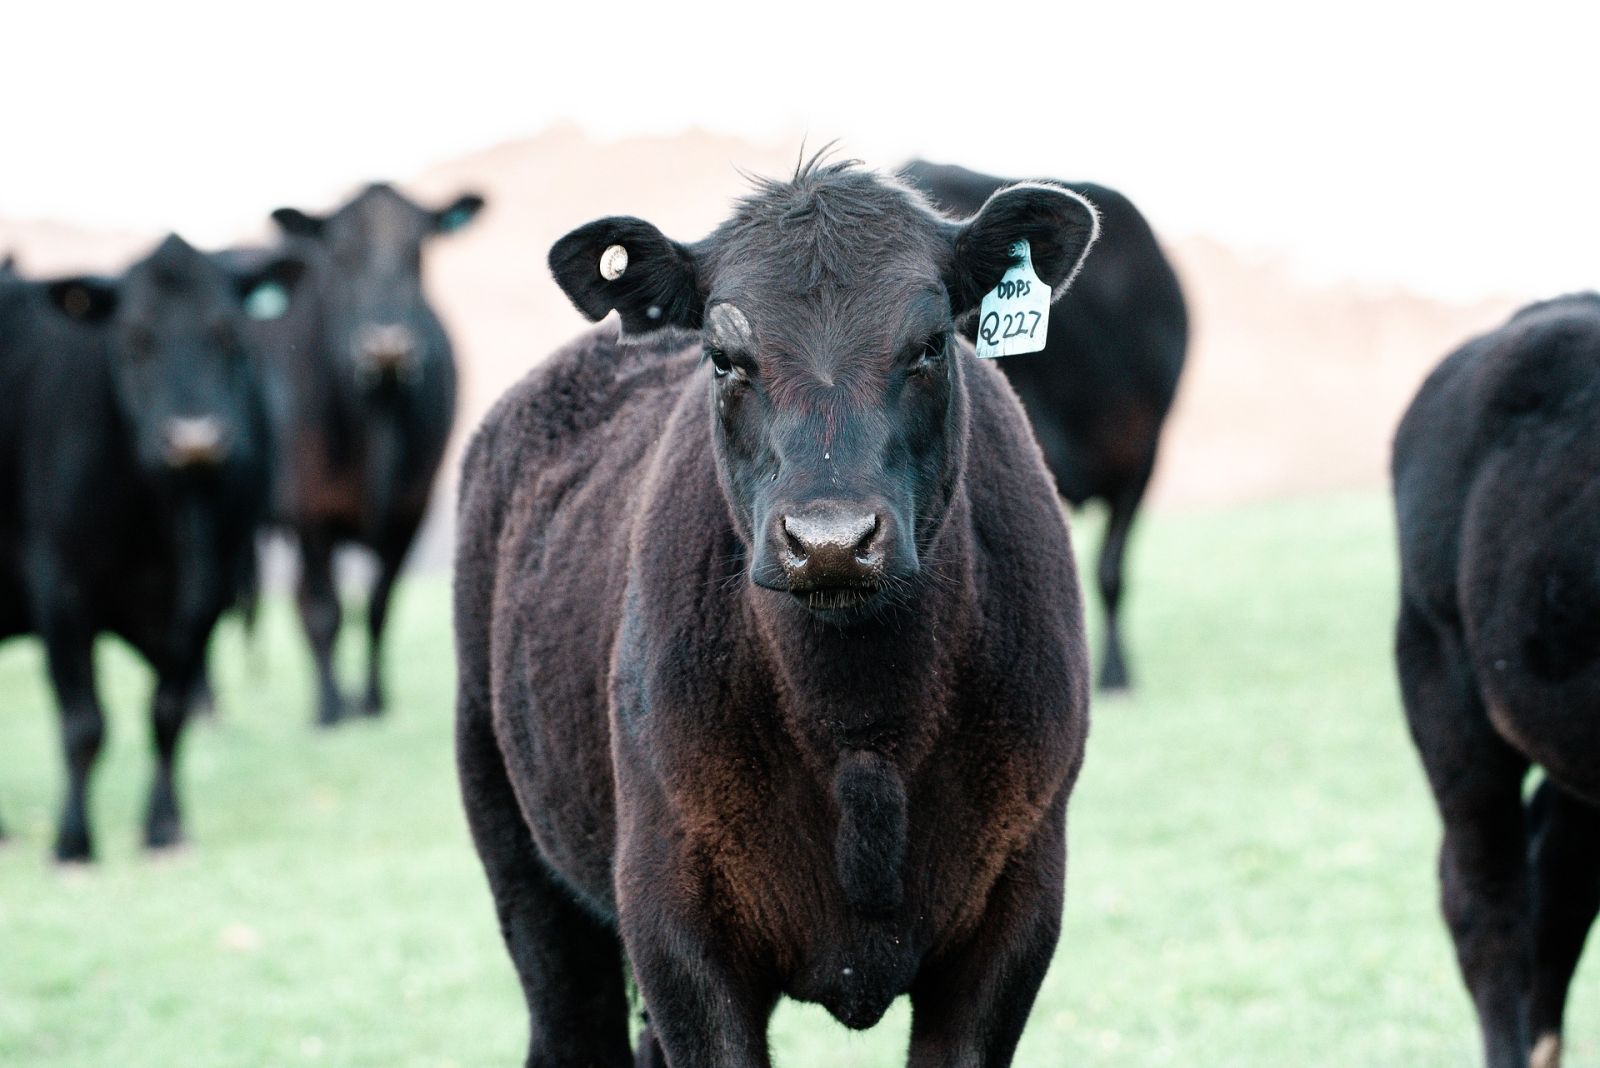
Price range this week continues to be confined within the end of last week's trading range.  The fly issue is creating a great deal of sensationalism, but not much change in the number of cattle or amount...

Wheat Posting Wednesday Gains

The wheat complex is showing higher trade across most contracts on Wednesday. Chicago SRW is trading with 4 to 5 cent gains at midday. KC HRW futures are up 1/2 to 1 ½ cents in the front months. MPLS...

KEU26 : 636-2 (-0.62%)
KEN26 : 627-2 (-0.52%)
MWN26 : 6.1900 (+0.16%)
ZWN26 : 585-0 (-0.43%)
ZWU26 : 597-4 (-0.33%)
Soybeans Posting Gains on Wednesday

Soybeans are showing 8 to 11 cent gains in most contracts on Wednesday. The cmdtyView national average Cash Bean price is up 12 cents at $10.70 3/4. Soymeal futures are up 90 cents to $1.60 at midday,...

ZSPAUS.CM : 10.6845 (+1.00%)
ZLN26 : 75.24 (-0.12%)
ZMN26 : 303.1 (+0.40%)
ZSPX26US.CM : 10.7169 (+0.61%)
ZSX26 : 1138-2 (-0.02%)
ZSN26 : 1120-4 (-0.22%)
ZSQ26 : 1125-6 (-0.18%)

Key Turning Points

3rd Resistance Point N/A
2nd Resistance Point 32.790
1st Resistance Point 32.790
Last Price 32.790s
1st Support Level 32.790
2nd Support Level 32.790
3rd Support Level N/A

See More

52-Week High 43.370
Fibonacci 61.8% 38.836
Fibonacci 50% 37.435
Fibonacci 38.2% 36.034
Last Price 32.790s
52-Week Low 31.500

See More

Want to use this as
your default charts setting?
Save this setup as a Chart Templates
Switch the Market flag
for targeted data from your country of choice.
Open the menu and switch the
Market flag for targeted data from your country of choice.
Want Streaming Chart Updates?
Switch your Site Preferences
to use Interactive Charts
Need More Chart Options?
Right-click on the chart to open the Interactive Chart menu.
Use your up/down arrows to move through the symbols.