Your browser of choice has not been tested for use with Barchart.com. If you have issues, please download one of the browsers listed here.
Less than $10/month! Screen on your Watchlists and Portfolios with Barchart Plus. FREE 30 Day Trial
Stocks | Futures | Watchlist | More
or

PJM Monthly Off Peak Jul '16 (JPN16)

[[ item.lastPrice ]] [[ item.priceChange ]] ([[ item.percentChange ]]) [[ item.tradeTime ]] [NYMEX]
[[ item.bidPrice ]] x [[ item.bidSize ]] [[ item.askPrice ]] x [[ item.askSize ]]
[[ rootItem.symbol ]]underlying price [[ rootItem.lastPrice ]] [[ rootItem.priceChange ]] ([[ rootItem.percentChange ]]) [[ rootItem.tradeTime ]]
Quote Overview for [[ item.sessionDateDisplayLong ]]
[[ rowChartData.labelLow ]]
[[ rowChartData.lowPriceFormatted ]]
[[ rowChartData.lowPrice ]]
[[ rowChartData.labelHigh ]]
[[ rowChartData.highPriceFormatted ]]
[[ rowChartData.highPrice ]]
since [[ rowChartData.lowDate ]]
since [[ rowChartData.highDate ]]
[[ value ]] [[ value ]]

Contract Specifications

See More
Contract
N/A
Contract Size
N/A
Tick Size
N/A
Trading Hours
N/A
Exchange
NYMEX
Point Value
N/A

Seasonal Chart

PJM Monthly Off Peak Jul '16
Average Price Chart for 5 Prior Jul Contracts
Get Realtime - Quotes and Charts for Futures Traders. Learn More >>

Price Performance

See More
Period Period Low Period High Performance
1-Month
23.18 unch
on 07/29/16
26.54 -12.66%
on 07/01/16
-3.44 (-12.92%)
since 06/29/16
3-Month
23.18 unch
on 07/29/16
28.25 -17.95%
on 05/04/16
-5.45 (-19.04%)
since 04/29/16
52-Week
23.18 unch
on 07/29/16
28.98 -20.01%
on 07/30/15
-6.11 (-20.86%)
since 07/29/15

More PJM Monthly Off Peak Quotes

All Futures Prices
Please wait...

Most Recent Stories

More News
Grains sector - a swing traders perspective

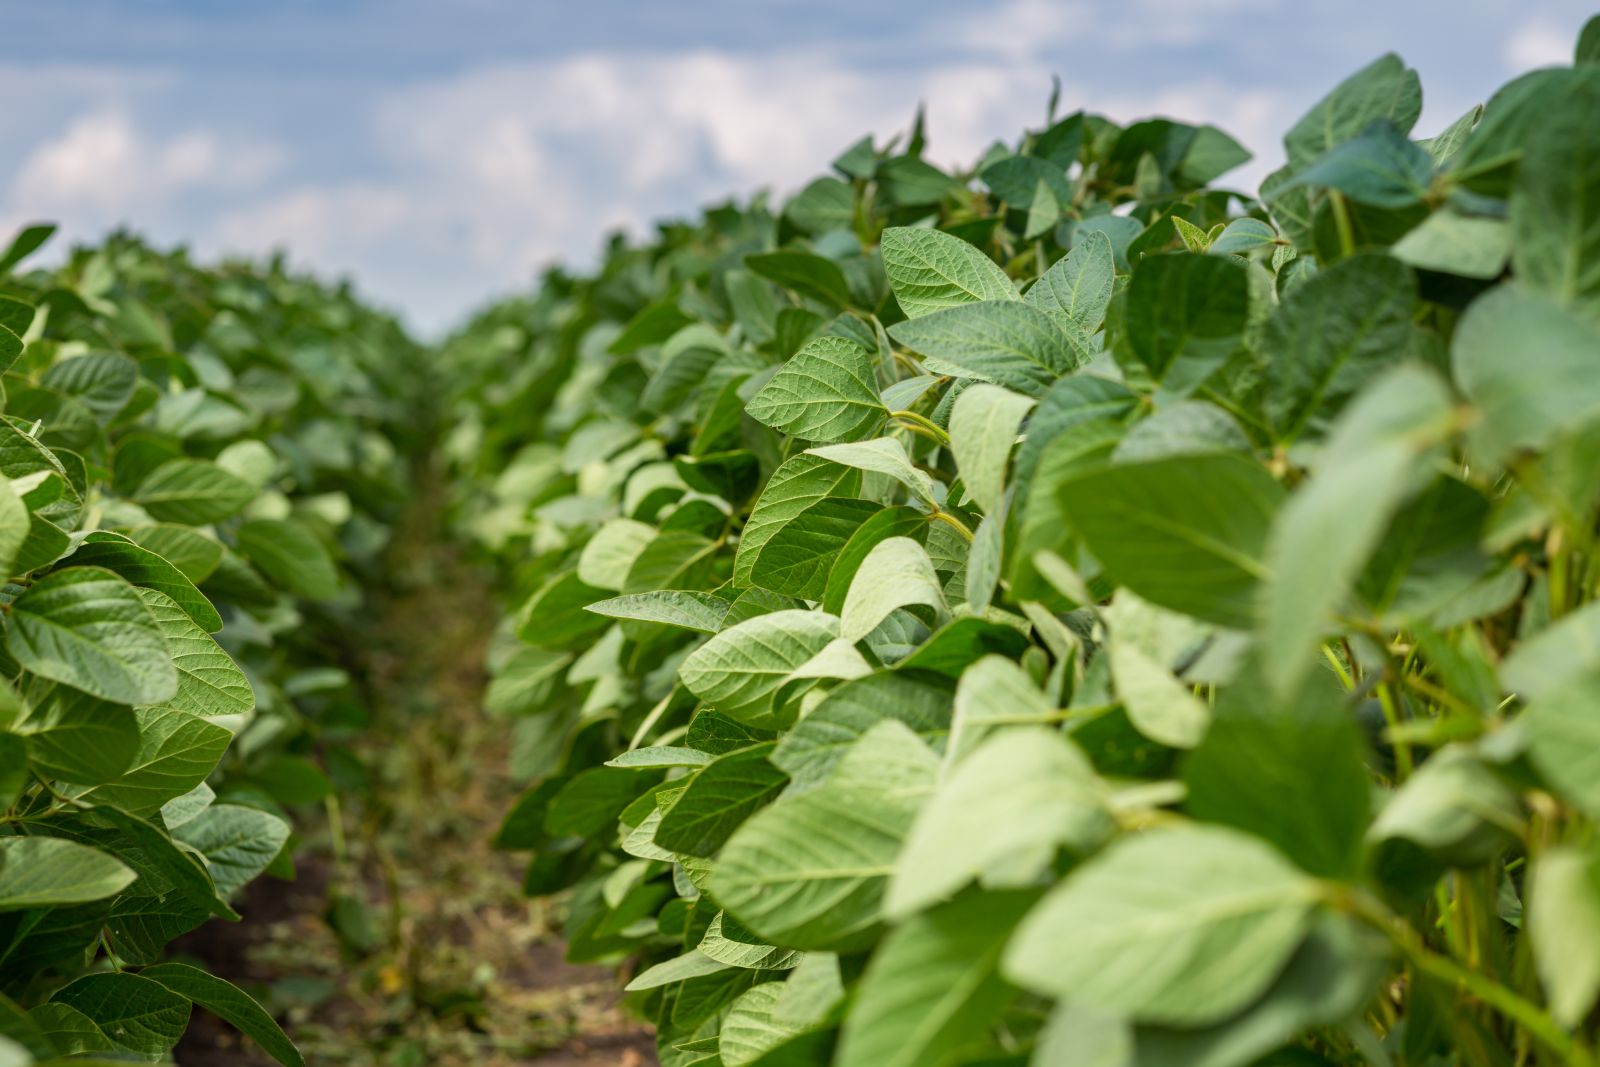
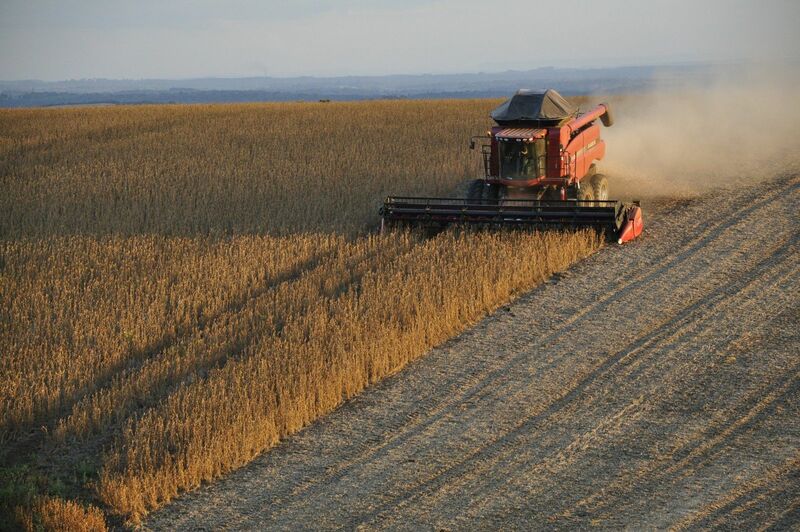
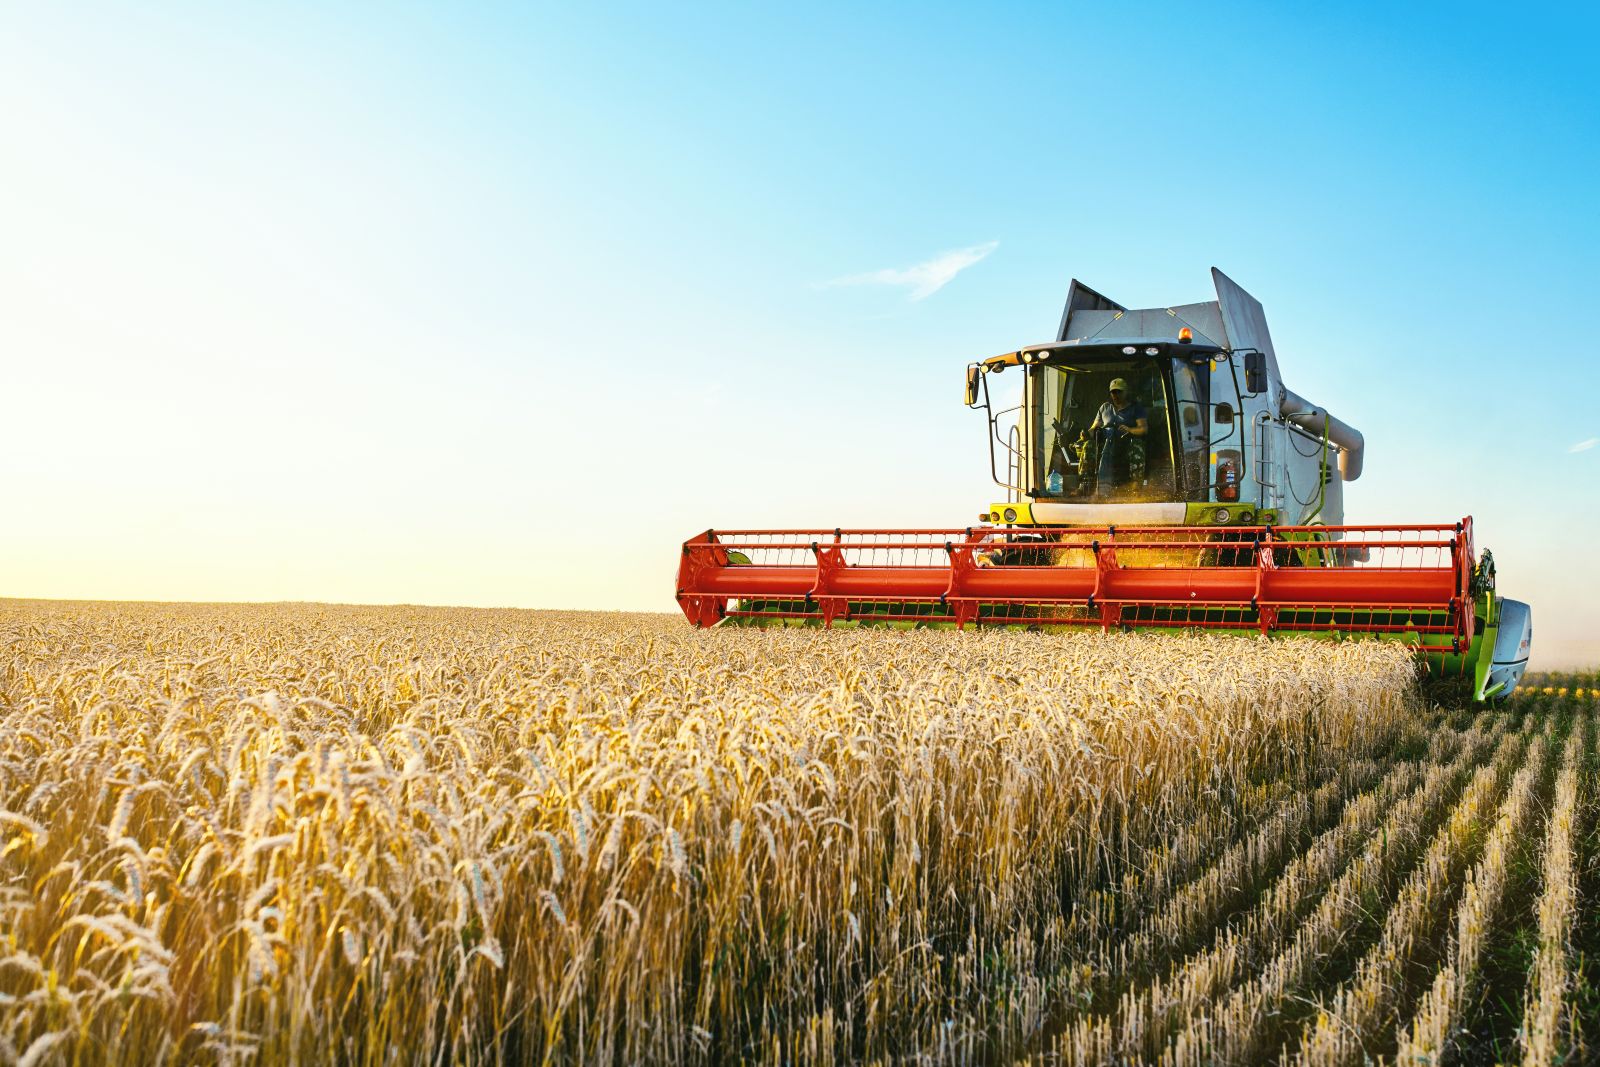
We give you our TA based analysis of grains

The Era of Weather Volatility Will Continue to Escalate Peaking in the mid 2030's

The History of Weather Volatility is Largely Driven by the 89-Year Solar Gleissberg Cycle, the 40-Year Sea Surface Temperature Cycle and the 220-Year Grande Solar Cycle Minimum. All three cycles are in...

How a weakening El Niño is causing a bear market in soft commodities and grain market volatility

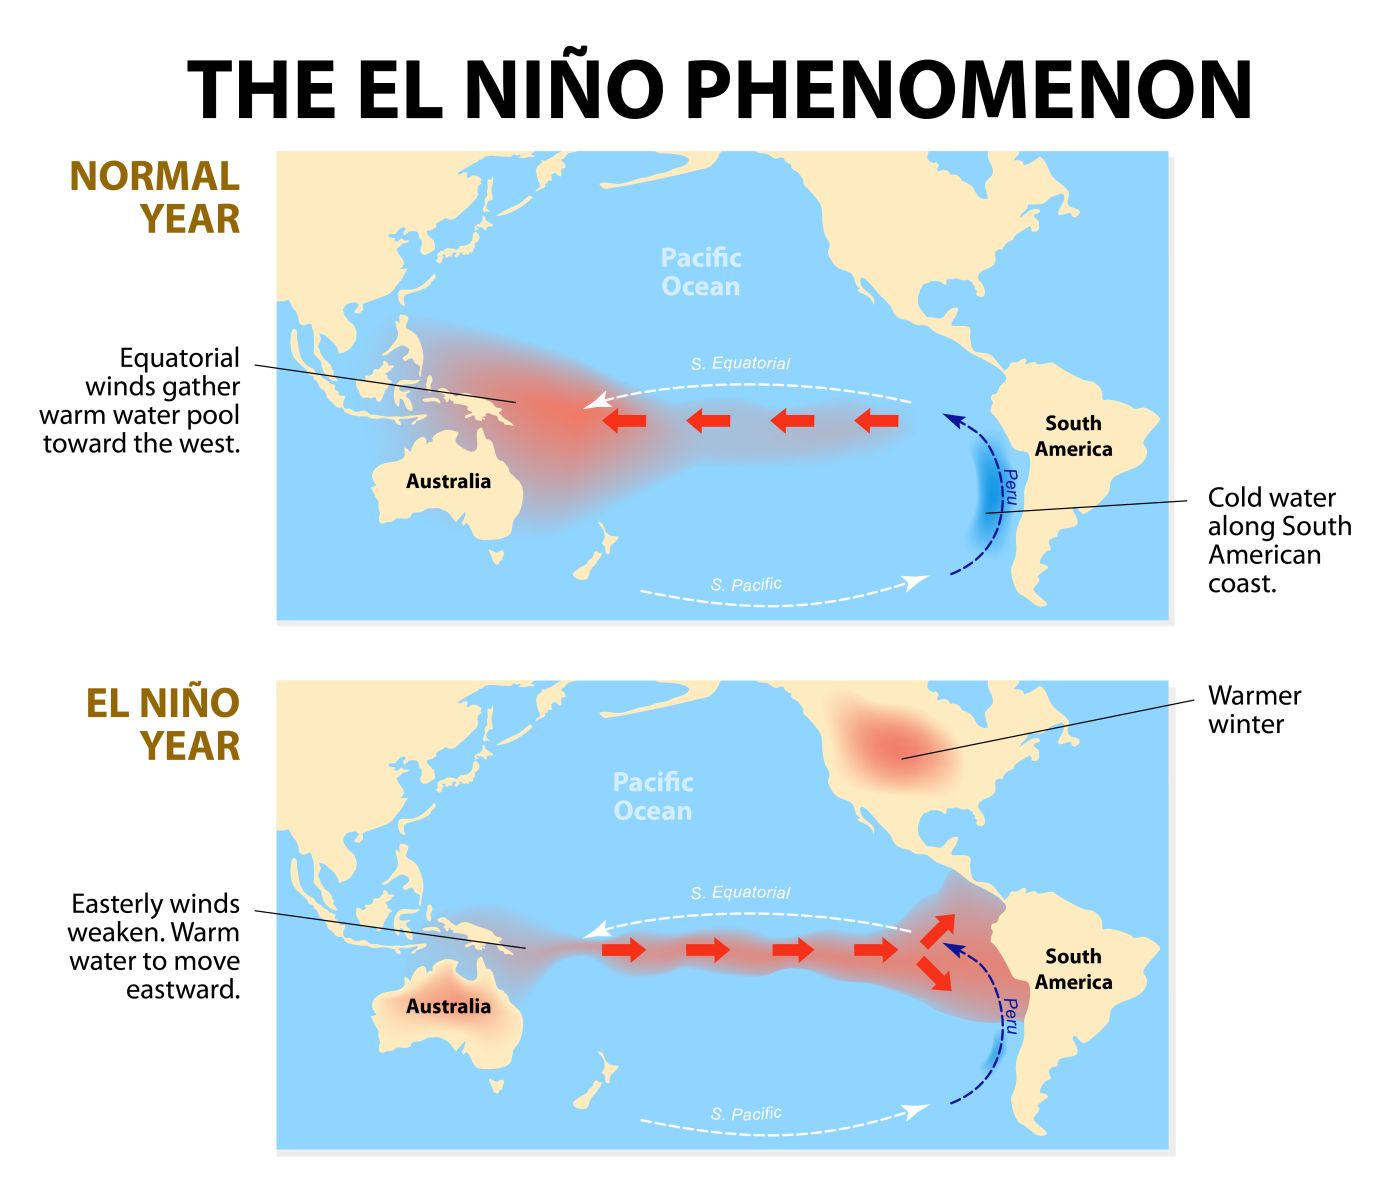
Jim's video focuses on weather and crop issues on four continents

ZSN24 : 1225-6 (-0.18%)
SOYB : 25.52 (+0.28%)
ZCN24 : 453-6 (+0.28%)
CORN : 20.31 (-0.93%)
ZWN24 : 659-2 (+1.23%)
KEN24 : 669-6 (+1.21%)
WEAT : 6.09 (-1.30%)
CCN24 : 7,348s (-0.61%)
KCN24 : 206.60s (+4.40%)
TAGS : 28.15 (-0.60%)
DBA : 23.49 (-0.04%)
Cattle Markets Strong, Hogs Weaken

Strong cash Drives cattle higher

Soybeans Hold in For Gains

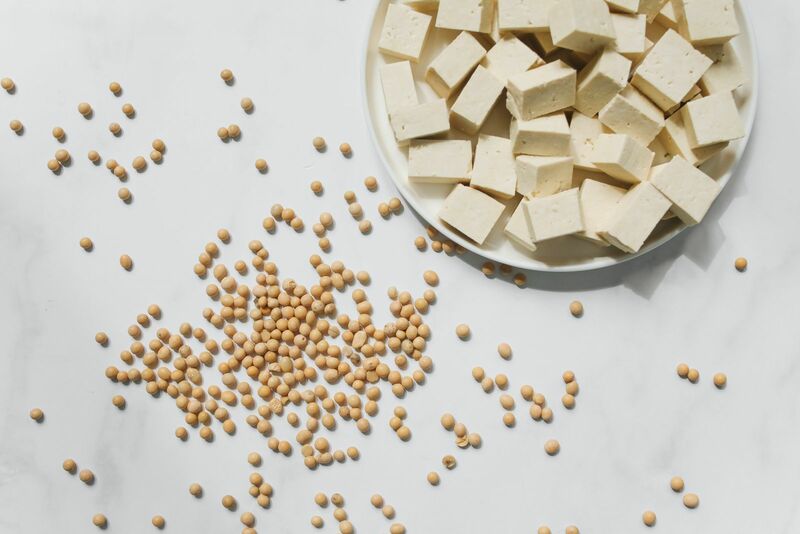
Soybeans held on for steady to 11 ¾ cent higher trade across the front months at the close, with back month 2025 contracts lower. July soybeans were up 9 cents this week, with November down 2 ¼. Soymeal...

ZMN24 : 366.6 (-0.60%)
ZLN24 : 45.31 (+0.09%)
ZSN24 : 1225-6 (-0.18%)
ZSPAUS.CM : 11.6622 (+1.07%)
ZSQ24 : 1221-2 (-0.33%)
ZSX24 : 1200-0 (-0.27%)
ZSPX24US.CM : 11.4157 (+0.38%)
Wheat Ends Friday with Double Digit Weakness

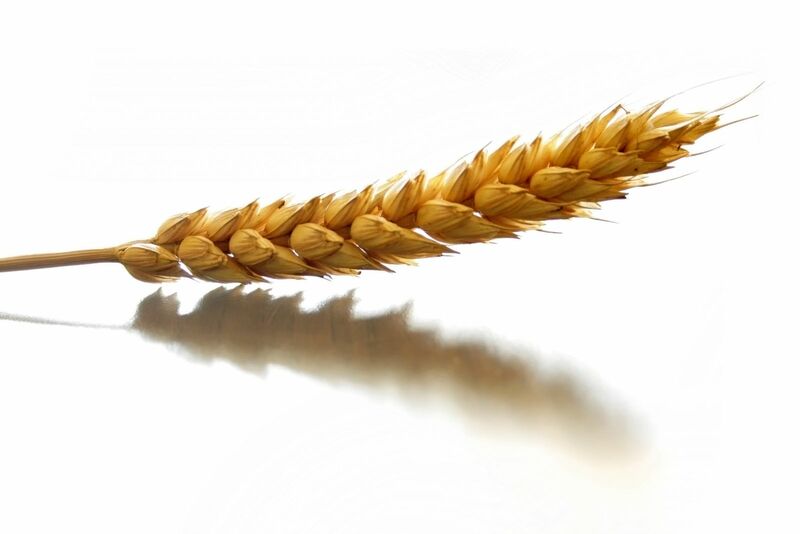
The wheat complex posted weakness across the board on Friday. Chicago contracts were down 2 to 12 cents, led by the front months. Kansas City futures closed with contracts 4 ¼ to 11 ½ cents. MPLS spring...

ZWN24 : 659-2 (+1.23%)
ZWU24 : 679-6 (+1.15%)
KEN24 : 669-6 (+1.21%)
KEU24 : 683-4 (+1.18%)
MWN24 : 718-2 (+0.95%)
Corn Ends the Week with Losses

Corn futures closed out the Friday session with losses across the board, as contracts were down 2 to 5 ¼ cents. On the week, July was down 17 ¼ cents, with December losing 15 ½ cents. Weekend weather...

ZCN24 : 453-6 (+0.28%)
ZCPAUS.CM : 4.2844 (-1.03%)
ZCU24 : 464-0 (+0.32%)
ZCZ24 : 478-4 (+0.42%)
ZCPZ24US.CM : 4.4657 (-1.22%)
Grain Spreads: ZSN24/X24 Examined

Old Crop/New Crop Featured

Pure Hedge - Livestock and Grain

Cattle Finish the Day and Week Higher. Hogs and Wheat Decline.

Who's Foolin' Who

Corn and Wheat price rallies reverse while inflation remains disappointingly stable.

Key Turning Points

3rd Resistance Point N/A
2nd Resistance Point 23.18
1st Resistance Point 23.18
Last Price 23.18s
1st Support Level 23.18
2nd Support Level 23.18
3rd Support Level N/A

See More

52-Week High 28.98
Fibonacci 61.8% 26.76
Fibonacci 50% 26.08
Fibonacci 38.2% 25.40
Last Price 23.18s
52-Week Low 23.18

See More

Want to use this as
your default charts setting?
Save this setup as a Chart Templates
Switch the Market flag
for targeted data from your country of choice.
Open the menu and switch the
Market flag for targeted data from your country of choice.
Want Streaming Chart Updates?
Switch your Site Preferences
to use Interactive Charts
Need More Chart Options?
Right-click on the chart to open the Interactive Chart menu.

Free Barchart Webinar