Your browser of choice has not been tested for use with Barchart.com. If you have issues, please download one of the browsers listed here.
Stocks | Futures | Watchlist | More
or

ULSD NY Harbor Nov '19 (HOX19)

[[ item.lastPrice ]] [[ item.priceChange ]] ([[ item.percentChange ]]) [[ item.tradeTime ]] [NYMEX]
[[ item.bidPrice ]] x [[ item.bidSize ]] [[ item.askPrice ]] x [[ item.askSize ]]
[[ rootItem.symbol ]]underlying price [[ rootItem.lastPrice ]] [[ rootItem.priceChange ]] ([[ rootItem.percentChange ]]) [[ rootItem.tradeTime ]]
Quote Overview for [[ item.sessionDateDisplayLong ]]
[[ rowChartData.labelLow ]]
[[ rowChartData.lowPriceFormatted ]]
[[ rowChartData.lowPrice ]]
[[ rowChartData.labelHigh ]]
[[ rowChartData.highPriceFormatted ]]
[[ rowChartData.highPrice ]]
since [[ rowChartData.lowDate ]]
since [[ rowChartData.highDate ]]
[[ value ]] [[ value ]]

Contract Specifications

See More
Contract
New York Harbor ULSD
Contract Size
42,000 gallons
Tick Size
$0.0001 (0.01 cent) per gallon ($4.20 per contract)
Trading Hours
5:00p.m. - 4:00p.m. (Sun-Fri) (RTH 8:00a.m. - 1:30p.m.) (Settles 1:30p.m.) CST
Exchange
NYMEX
Point Value
$42,000
Margin/Maintenance
$7,517/6,834
First Notice Date
11/04/19
Expiration Date
10/31/19 (expired)

Seasonal Chart

ULSD NY Harbor Nov '19
Average Price Chart for 5 Prior Nov Contracts

Commitment of Traders Positions as of May 28, 2024

View Chart Details
Commercials - Long / Short
181,459 (-8,450)
212,524 (-3,038)
Non-Commercials - Long / Short
51,761 (+5,081)
28,037 (-696)
Producers - Long / Short
104,614 (-8,943)
198,379 (-1,331)
Swap Dealers - Long / Short
64,087 (+3,352)
1,387 (+1,152)
Managed Money - Long / Short
33,004 (+1,801)
22,656 (+315)
Other Reportables - Long / Short
18,757 (+3,280)
5,381 (-1,011)
Get Realtime - Quotes and Charts for Futures Traders. Learn More >>

Price Performance

See More
Period Period Low Period High Performance
1-Month
1.8239 +2.97%
on 10/03/19
1.9924 -5.74%
on 10/24/19
-0.0192 (-1.01%)
since 09/30/19
3-Month
1.7554 +6.98%
on 08/07/19
2.0935 -10.29%
on 09/17/19
-0.0844 (-4.30%)
since 07/30/19
52-Week
1.6694 +12.50%
on 12/26/18
2.2736 -17.40%
on 10/31/18
-0.3782 (-16.76%)
since 10/30/18

More ULSD NY Harbor Quotes

All Futures Prices
Please wait...

Most Recent Stories

More News
3 High-Yield Dividend Stocks to Build a Passive Income Stream

When the market pulls back, it's an opportunity to invest in high-yield dividend stocks like Kenvue, Enterprise Products Partners, and Verizon, which offer attractive yields and growth potential.

$SPX : 5,283.40 (+0.11%)
KVUE : 19.24 (-0.31%)
EPD : 28.23 (-0.95%)
VZ : 40.98 (-0.41%)
JNJ : 147.74 (+0.73%)
NGN24 : 2.763 (+0.25%)
CLN24 : 73.87 (-0.47%)
WES : 36.63 (-1.85%)
$DOWI : 38,571.03 (-0.30%)
Nat-Gas Prices Soar as an Outage Cuts Norwegian Gas Supplies

July Nymex natural gas (NGN24 ) on Monday closed up sharply by +0.169 (+6.53%). July nat-gas prices soared Monday on carryover support from a rally in European nat-gas prices to a 6-month high. Nat-gas...

NGN24 : 2.763 (+0.25%)
Crude Prices Fall Sharply on OPEC+ Plans to Restore Crude Production

July WTI crude oil (CLN24 ) on Monday closed down -2.77 (-3.60%), and July RBOB gasoline (RBN24 ) closed down -8.18 (-3.39%). Crude oil and gasoline prices tumbled to 3-month lows on Monday. Crude prices...

CLN24 : 73.87 (-0.47%)
RBN24 : 2.3260 (-0.41%)
Grain Crushings

Grain Crushings - 2024-06-03

ZCN24 : 441-2 (-0.51%)
ZCPAUS.CM : 4.2363 (-0.81%)
ZCBAUS.CM : -0.1987 (-3.76%)
XVN24 : 2,437s (+0.12%)
XEU24 : 60.64 (+0.25%)
FLN24 : 1.79500s (-0.83%)
ZCDAUS-BIW.CM : 15,671,136 (unch)
ZCYAUS-BIW.CM : 183.74 (unch)
XBQ24 : 225.75s (+0.22%)
3 Top-Rated Utility Stocks to Scoop Up Now

With utility stocks riding the wave of soaring power demand, here are three top-notch Goldman Sachs utility picks.

XLU : 71.89 (-1.14%)
GS : 454.98 (-0.34%)
SRE : 76.71 (-0.42%)
XEL : 55.28 (-0.31%)
ES : 59.68 (+0.76%)
NGN24 : 2.763 (+0.25%)
Crude Prices Slump on OPEC+ Plans to Restore Crude Production

July WTI crude oil (CLN24) today is down -2.69 (-3.49%), and July RBOB gasoline (RBN24 ) is down -6.98 (-2.89%). Crude oil and gasoline prices today fell sharply to 3-month lows. Crude prices are falling...

CLN24 : 73.87 (-0.47%)
RBN24 : 2.3260 (-0.41%)
How Is Chevron's Stock Performance Compared to Other Mega-Caps?

With Chevron recently outperforming the Vanguard Mega Cap ETF, investors remain highly optimistic about the stock’s prospects because of its improving financials.

CVX : 157.46 (-2.98%)
$DOWI : 38,571.03 (-0.30%)
XOM : 114.45 (-2.40%)
MGC : 189.67 (+0.33%)
HES : 149.26 (-3.14%)
Morning Express

Bill Baruch joined the CNBC Halftime Report on Friday with a new position added to portfolios, from the energy sector.
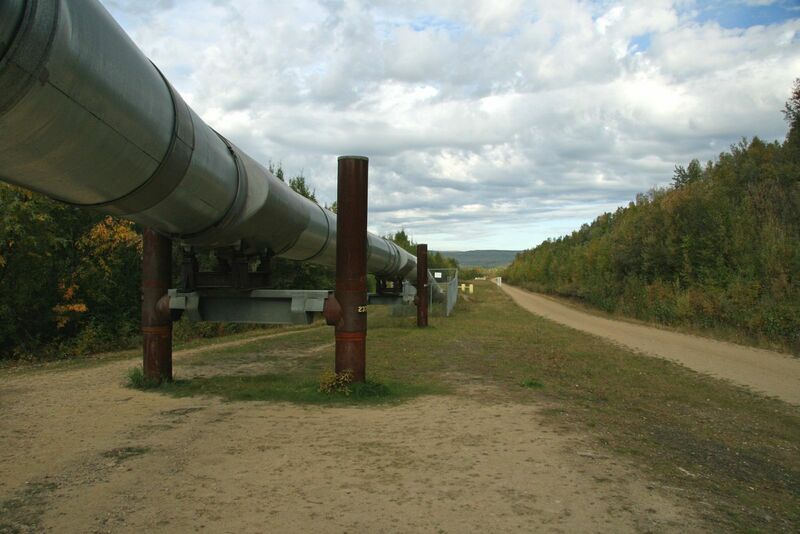
Up 27% YTD, Is This Energy Dividend Stock Overvalued?

Western Midstream is a midstream company that pays shareholders a tasty dividend yield amid an uncertain and volatile macro environment in 2024.

CLN24 : 73.87 (-0.47%)
NGN24 : 2.763 (+0.25%)
WES : 36.63 (-1.85%)
Heating Oil calendar spread, and a Cocoa butterfly spread

Heating Oil is hovering above the lows from late last year.  Heating Oil has also formed 2 bullish divergences where the Relative Strength Index has increased while prices have decreased.

Key Turning Points

3rd Resistance Point N/A
2nd Resistance Point 1.9330
1st Resistance Point 1.9055
Last Price 1.8780s
1st Support Level 1.8595
2nd Support Level 1.8410
3rd Support Level N/A

See More

52-Week High 2.2736
Fibonacci 61.8% 2.0428
Fibonacci 50% 1.9715
Fibonacci 38.2% 1.9002
Last Price 1.8780s
52-Week Low 1.6694

See More

Solutions for Energy Professionals barchart.com/cmdty
Energy Data and Statistics
Explore Data
cmdtyView Pro for Commodity Professionals
Start Free Trial
We help Energy Professionals make better decisions
Learn Now
Want to use this as
your default charts setting?
Save this setup as a Chart Templates
Switch the Market flag
for targeted data from your country of choice.
Open the menu and switch the
Market flag for targeted data from your country of choice.
Want Streaming Chart Updates?
Switch your Site Preferences
to use Interactive Charts
Need More Chart Options?
Right-click on the chart to open the Interactive Chart menu.

Free Barchart Webinar