Your browser of choice has not been tested for use with Barchart.com. If you have issues, please download one of the browsers listed here.
UNLIMITED Watchlists, Portfolios, Screeners, and other Barchart tools with Barchart Premier. FREE 30 Day Trial
Stocks | Futures | Watchlist | More
or

Uranium Apr '15 (UXJ15)

[[ item.lastPrice ]] [[ item.priceChange ]] ([[ item.percentChange ]]) [[ item.tradeTime ]] [NYMEX]
[[ item.bidPrice ]] x [[ item.bidSize ]] [[ item.askPrice ]] x [[ item.askSize ]]
[[ rootItem.symbol ]]underlying price [[ rootItem.lastPrice ]] [[ rootItem.priceChange ]] ([[ rootItem.percentChange ]]) [[ rootItem.tradeTime ]]
Quote Overview for [[ item.sessionDateDisplayLong ]]
[[ rowChartData.labelLow ]]
[[ rowChartData.lowPriceFormatted ]]
[[ rowChartData.lowPrice ]]
[[ rowChartData.labelHigh ]]
[[ rowChartData.highPriceFormatted ]]
[[ rowChartData.highPrice ]]
since [[ rowChartData.lowDate ]]
since [[ rowChartData.highDate ]]
[[ value ]] [[ value ]]

Contract Specifications

See More
Contract
Uranium Futures
Contract Size
250 pounds of U308 0.05 x 250 500
Tick Size
5 cents per pound ($12.50 per contact)
Trading Hours
5:00p.m. - 4:00p.m. (Sun-Fri) CST
Exchange
NYMEX
Point Value
$1,250
Expiration Date
04/30/15 (expired)

Seasonal Chart

Uranium Apr '15
Average Price Chart for 5 Prior Apr Contracts
Get Realtime - Quotes and Charts for Futures Traders. Learn More >>

Price Performance

See More
Period Period Low Period High Performance
1-Month
38.15 +0.26%
on 04/27/15
39.50 -3.16%
on 04/01/15
-1.25 (-3.16%)
since 03/30/15
3-Month
37.65 +1.59%
on 02/02/15
40.15 -4.73%
on 03/19/15
+0.80 (+2.14%)
since 01/30/15
52-Week
28.65 +33.51%
on 05/20/14
44.40 -13.85%
on 11/17/14
+6.50 (+20.47%)
since 04/30/14

More Uranium Quotes

All Futures Prices
Please wait...

Most Recent Stories

More News
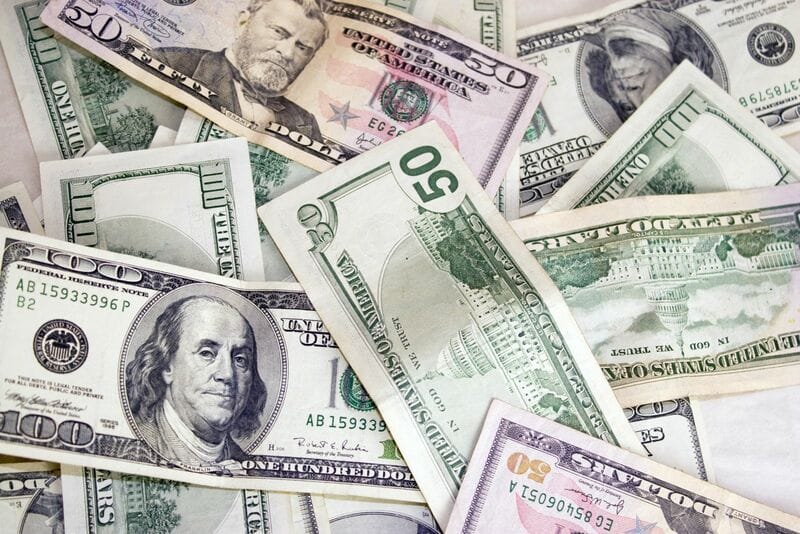
2 Top ETFs to Invest in the 'Inevitable' Copper Boom

Explore the potential of investing in copper through two key ETFs, which are poised to benefit from increasing demand for the metal in AI and renewable energy initiatives.
HGN24 : 4.5305 (-0.74%)
GCM24 : 2,297.5 (-0.23%)
SIN24 : 26.705 (+0.19%)
BAC : 37.01 (-1.44%)
C : 61.33 (-1.49%)
CPER : 28.31 (-2.68%)
COPX : 45.77 (-4.69%)
IVPAF : 13.5200 (-10.41%)
ANFGF : 28.2500 (unch)
LUNMF : 11.4100 (-4.92%)
SCCO : 116.67 (-3.46%)
BHP : 55.16 (-2.90%)
Dollar Rallies Ahead of an Expected Hawkish FOMC Wednesday

The dollar index (DXY00 ) on Tuesday rose to a 1-week high and finished up by +0.60%. The dollar rallied Tuesday after T-note yields jumped when the US Q1 employment cost index rose more than expected,...

DXY00 : 106.401 (+0.17%)
^EURUSD : 1.06579 (-0.08%)
^USDJPY : 157.876 (+0.05%)
GCM24 : 2,297.5 (-0.23%)
SIN24 : 26.705 (+0.19%)
Pan American Silver (PAAS) Rally in Impulsive Structure

Pan American Silver (PAAS) is a well-established Canadian silver mining company operating globally. It has assets primarily in the Americas, including Mexico, Peru, Bolivia, and Argentina. Known for its...

PAAS : 18.44 (-4.11%)
Gold and Silver Show the Way

Both key precious metals moved decisively lower today, which is in perfect tune with their recent price patterns.

Stocks Weaken as Rising US Wage Costs Curb Fed Rate Cut Expectations

The S&P 500 Index ($SPX ) (SPY ) this morning is down -0.18%, the Dow Jones Industrials Index ($DOWI ) (DIA ) is down -0.36%, and the Nasdaq 100 Index ($IUXX ) (QQQ ) is down -0.19%. US stock indexes...

$SPX : 5,035.69 (-1.57%)
SPY : 501.98 (-1.58%)
$DOWI : 37,815.92 (-1.49%)
DIA : 378.13 (-1.48%)
$IUXX : 17,440.69 (-1.92%)
QQQ : 424.59 (-1.89%)
ZNM24 : 107-170 (+0.09%)
GEHC : 76.24 (-14.28%)
FFIV : 165.31 (-9.24%)
TAP : 57.26 (-9.91%)
PCAR : 106.11 (-6.63%)
YUMC : 36.51 (-8.82%)
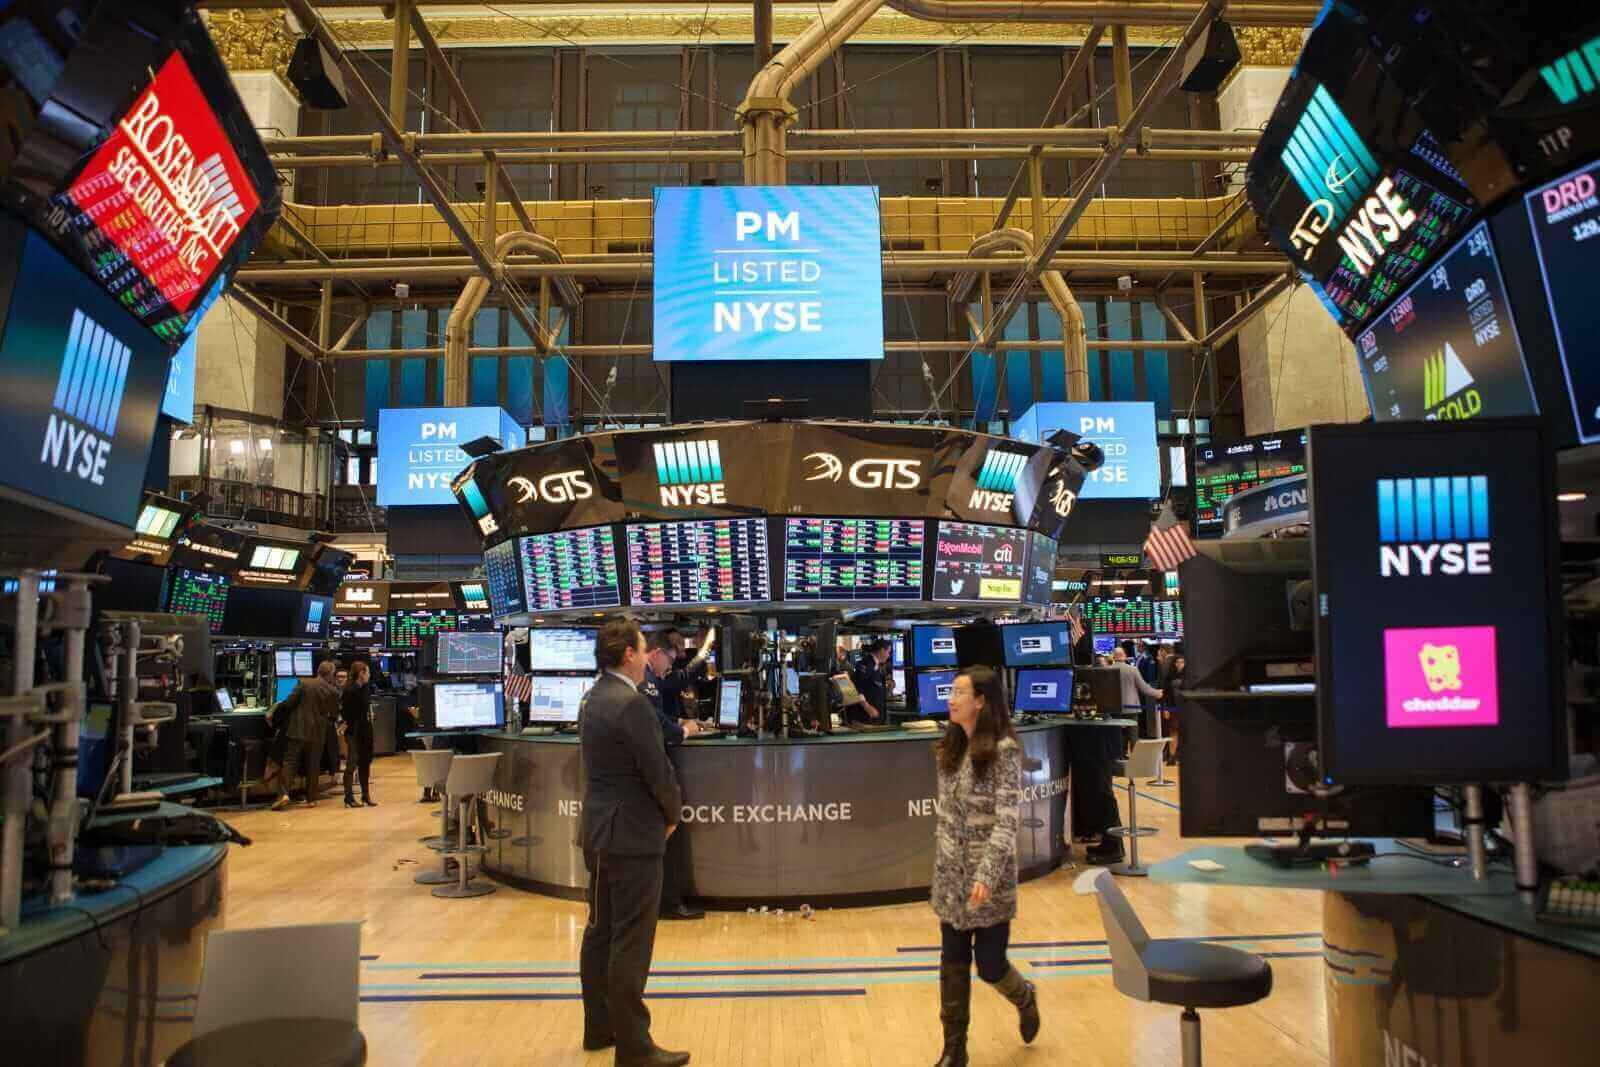
Dollar Climbs and Gold Falls as US Labor Costs Accelerate

The dollar index (DXY00 ) today is up by +0.28%. The dollar is moving higher today after T-note yields jumped when the US Q1 employment cost index rose more than expected, a sign of wage pressures and...
DXY00 : 106.401 (+0.17%)
^EURUSD : 1.06579 (-0.08%)
^USDJPY : 157.876 (+0.05%)
GCM24 : 2,297.5 (-0.23%)
SIN24 : 26.705 (+0.19%)
Stocks Slip as Rising US Labor Costs May Keep the Fed Hawkish

The S&P 500 Index ($SPX ) (SPY ) this morning is down -0.29%, the Dow Jones Industrials Index ($DOWI ) (DIA ) is down -0.48%, and the Nasdaq 100 Index ($IUXX ) (QQQ ) is down -0.35%. US stock indexes...

$SPX : 5,035.69 (-1.57%)
SPY : 501.98 (-1.58%)
$DOWI : 37,815.92 (-1.49%)
DIA : 378.13 (-1.48%)
$IUXX : 17,440.69 (-1.92%)
QQQ : 424.59 (-1.89%)
ZNM24 : 107-170 (+0.09%)
FFIV : 165.31 (-9.24%)
GEHC : 76.24 (-14.28%)
PCAR : 106.11 (-6.63%)
YUMC : 36.51 (-8.82%)
STLA : 22.30 (-10.51%)
Elliott Wave Intraday Analysis on GDX: Further Rally Expected

Short Term Elliott Wave View on (GDX) suggests that rally to 35.74 ended wave 3 on April 12, 2024. From there, the ETF pullback as a double three Elliott Wave structure. Down from wave 3, wave (a) ended...

GDX : 33.13 (-4.72%)
Dollar Eases on Weaker T-Note Yields and a Stronger Yen

The dollar index (DXY00 ) on Monday fell by -0.29%. The dollar on Monday posted moderate losses, weighed down by lower T-note yields. Also, Monday’s stock rally reduced liquidity demand for the dollar....

DXY00 : 106.401 (+0.17%)
^EURUSD : 1.06579 (-0.08%)
^USDJPY : 157.876 (+0.05%)
GCM24 : 2,297.5 (-0.23%)
SIN24 : 26.705 (+0.19%)
Strong Q1 Earnings and Lower Bond Yields Boost Stocks

The S&P 500 Index ($SPX ) (SPY ) this morning is up +0.26%, the Dow Jones Industrials Index ($DOWI ) (DIA ) is up +0.13%, and the Nasdaq 100 Index ($IUXX ) (QQQ ) is up +0.24%. US stock indexes this morning...

$SPX : 5,035.69 (-1.57%)
SPY : 501.98 (-1.58%)
$DOWI : 37,815.92 (-1.49%)
DIA : 378.13 (-1.48%)
$IUXX : 17,440.69 (-1.92%)
QQQ : 424.59 (-1.89%)
ZNM24 : 107-170 (+0.09%)
TSLA : 183.28 (-5.55%)
ALB : 120.31 (-4.31%)
PARA : 11.39 (-7.02%)
DPZ : 529.27 (+0.41%)
HTLF : 42.11 (+2.38%)

Key Turning Points

3rd Resistance Point N/A
2nd Resistance Point 38.25
1st Resistance Point 38.25
Last Price 38.25s
1st Support Level 38.25
2nd Support Level 38.25
3rd Support Level N/A

See More

52-Week High 44.40
Fibonacci 61.8% 38.38
Last Price 38.25s
Fibonacci 50% 36.53
Fibonacci 38.2% 34.67
52-Week Low 28.65

See More

Want to use this as
your default charts setting?
Save this setup as a Chart Templates
Switch the Market flag
for targeted data from your country of choice.
Open the menu and switch the
Market flag for targeted data from your country of choice.
Want Streaming Chart Updates?
Switch your Site Preferences
to use Interactive Charts
Need More Chart Options?
Right-click on the chart to open the Interactive Chart menu.

Free Barchart Webinar