Tips on Technicals - Divergence
Divergence on a chart exists when the relative trends of price and studies are moving in different directions. For example, if the price of Gold is making higher highs (trending higher) and an oscillator study on Gold is making lower highs (trending lower), a bearish divergence exists. Divergence can be bullish or bearish.
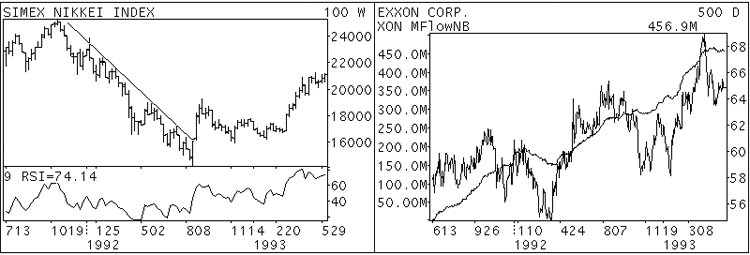
Studies, such as RSI, Stochastics and Volume, as well as overlays, such as Money Flow, Cumulative Volume and Price, can all exhibit divergences with price. Typically, divergences are resolved when the price moves in the direction of the study. In Figure 1, the SIMEX Nikkei Index was making lower weekly lows throughout the first half of 1992. In June, the Relative Strength Index (RSI) did not make a lower low. Again, in August, the RSI actually made a higher low. The Nikkei Index soon reversed direction and began a six month rally.
How it works
The question to ask now is "How can RSI go up when price is going down?"
Since RSI measures relative strength, which is similar to momentum, let's use an analogy. An automobile has an accelerator pedal and a brake pedal. If you are driving and step on the brakes for a few seconds, the car slows down. However, unless you step on the brakes with enough force, the car will still move forward. It is the same with a market. Each time selling pressure outweighs buying pressure, the brakes are applied and the RSI goes down a little. Each time buying outweighs selling, the accelerator is applied and the car speeds up (RSI goes up). Eventually, if the brakes are used with greater force than the accelerator, the car will stop. RSI will be trending lower while the price rally will come to an end.
In order for a study such as RSI to predict a possible reversal in trend based on divergence, it's value should reach an overbought or oversold level. In the Nikkei chart, the RSI was near 25 which indicated an oversold condition1. Typically, below 25 means oversold and above 75 (all on a scale of 1 - 100) means overbought. An oversold market usually stops going down although it does not always start to go up. Use an oversold condition to close out short positions but wait for other indicators to confirm a buy signal. A divergence in RSI that happens between 25 and 75 is generally not a good trend change indicator.

In Figure 2, the money flow for Exxon Corp. showed a steady increase for two years2. Throughout that period, the price of Exxon moved significantly away from the money flow line several times and each time the price of the stock moved back in the direction of money flow. As is evident in March 1992, December 1992 and January 1993, price moved fairly quickly for a fast profit. For divergences in overlays such as money flow, look for times when the relative directions of the two lines are different. The absolute divergences are not significant -- only the relative slopes of the lines.

The June 1993 Gold contract in Figure 3 broke out of a long-term bear market in March. Both RSI and Stochastics showed higher lows (bullish) from October 1992 until the rally began in March 1993. Both studies later showed bearish divergences starting in May 1993 after reaching overbought levels. This led to the big sell-off at the start of June. Note that this divergence started earlier in the Stochastic than the RSI. This is because RSI is more reliable in a trending market.
Volume can also show divergence with price but is a more reliable predictor of market tops than of bottoms. July Orange Juice (Figure 4) has had a nice rally since January 1993 but while prices were peaking in late May, volume peaked several weeks earlier. Declining volume here indicates that there was less buying pressure for the commodity and therefore an internal market weakness. The contract eventually broke its rising trend line and went into a 2-week slide.
1 See chapter "Relative Strength Index (RSI)"
2 See chapter "Money Flow"


