Stock Screener
Barchart for Excel gives you the ability to create and save custom stock screeners in Excel in addition to pulling in saved screeners from your My Barchart account. The Stocks Screener allows you to search for equities using custom filters that you apply. The screener results return a snapshot of the request. While the screener results themselves will not update unless the query is refreshed, the underlying equity price data (open, high, low, last, volume, etc.) will continue to update once inserted into the spreadsheet.
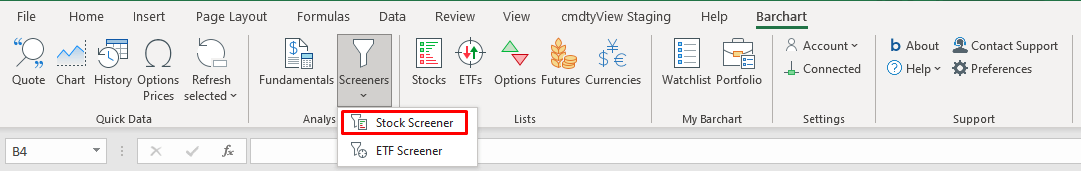
After selecting the Stock Screener in the Barchart for Excel ribbon, the Screener dialogue will display with all of the available filters.
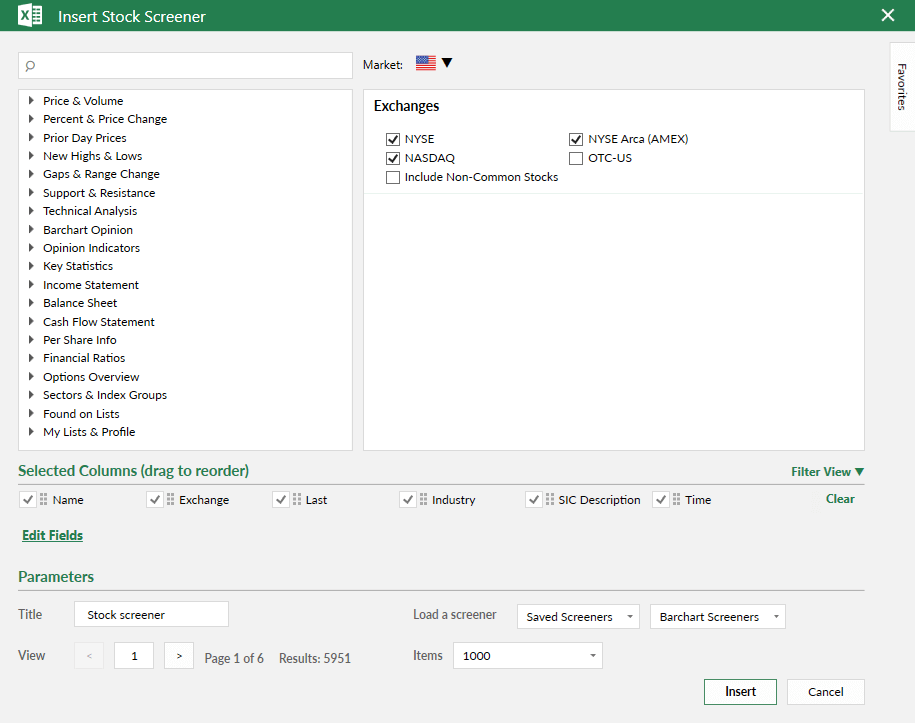
Each filter presents different options on which to screen. Many give you the option to enter a greater than or less than "value", or to enter a range of "values":
- Last Price => greater than [value] => 10.00
- Volume => between [values] => 1,000,000 and 3,000,000
Other filters allow you to identify additional criteria and compare the data to another 'field":
- Price Change => 1-Month => greater than [field] => 6-Month Price Change
- 50-Day Moving Average => less than [field] => Last Price
The New High Date and New Low Date filters allow you to enter a specific date range, or you can perform a screen relative to the current date.
- New 5-Day High Date made within the last session (today)
- New 52-Week Low Date made within the last 2-weeks
Still, other filters ask you to identify a specific value defined in our database:
- Opinion => Trend Spotter => Buy
- Index Group => S&P 500
The Screener lets you either find filters using the different filter categories, or you may search for a filter by entering a keyword in the search box.
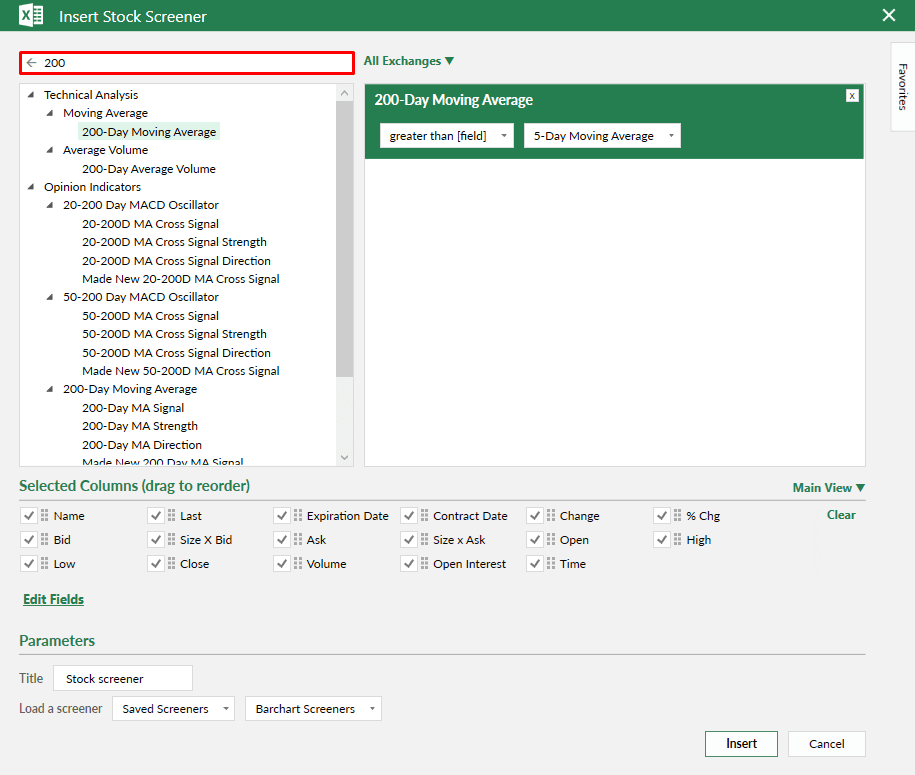
Filters with the keyword in their description are displayed, allowing you to choose the one you want. Once you choose a filter, you must still "Add" the filter to the screener.
The Markets drop down menu allows you to select the overall market to screen on.
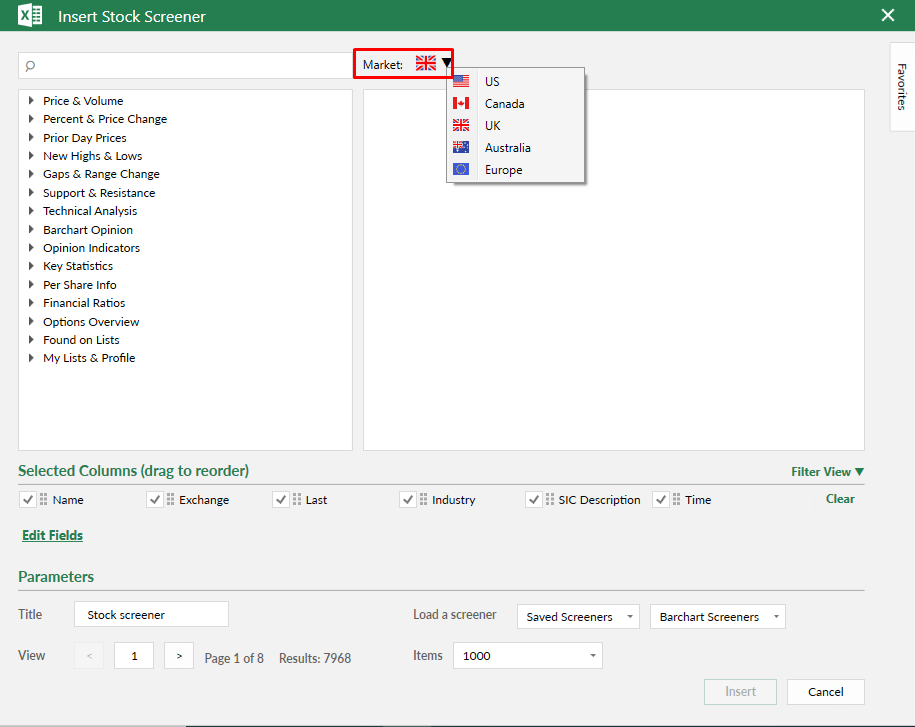
Depending on the Market selected, further filtering can be applied based on Exchanges. For the U.S. Market, equities covered include NYSE, NYSE Arca (AMEX), NASDAQ, and OTC-US ("Pink Sheets"). You may also choose to exclude Non-Common stocks using the check box provided in the "Exchanges" section on the Filter tab. Non Common Stocks are NYSE, Nasdaq, and NYSE Arca stocks classified as unit investment trusts, closed-end funds, warrant stocks, preferred securities, and any non-SIC classified stock. Non-U.S. markets include equities on the Toronto (TSX), Toronto Venture (TSX-V), London (LSE), or Australian (ASX) exchanges. In addition, the European market allows you to further filter by country/region.
Check out our User Guide to learn about selected columns and views, how to save a screener, and how to load a saved screener.