Contract Specifications
See MoreContract
N/A
Contract Size
N/A
Tick Size
N/A
Trading Hours
N/A
Exchange
NYMEX
Point Value
$100
Expiration Date
10/05/12 (expired)

Barchart is a leading provider of market data and services to the global financial, media, and commodity industries. From our interactive charting library, through to our leading financial analysis desktops, we connect you to the content you need.

Corn futures closed out the Thursday session with losses of 3 ¾ to 7 cents across the board. The front month national Cash Corn price from cmdtyView was down 7 cents to match Dec, settling at $3.71 1/2...
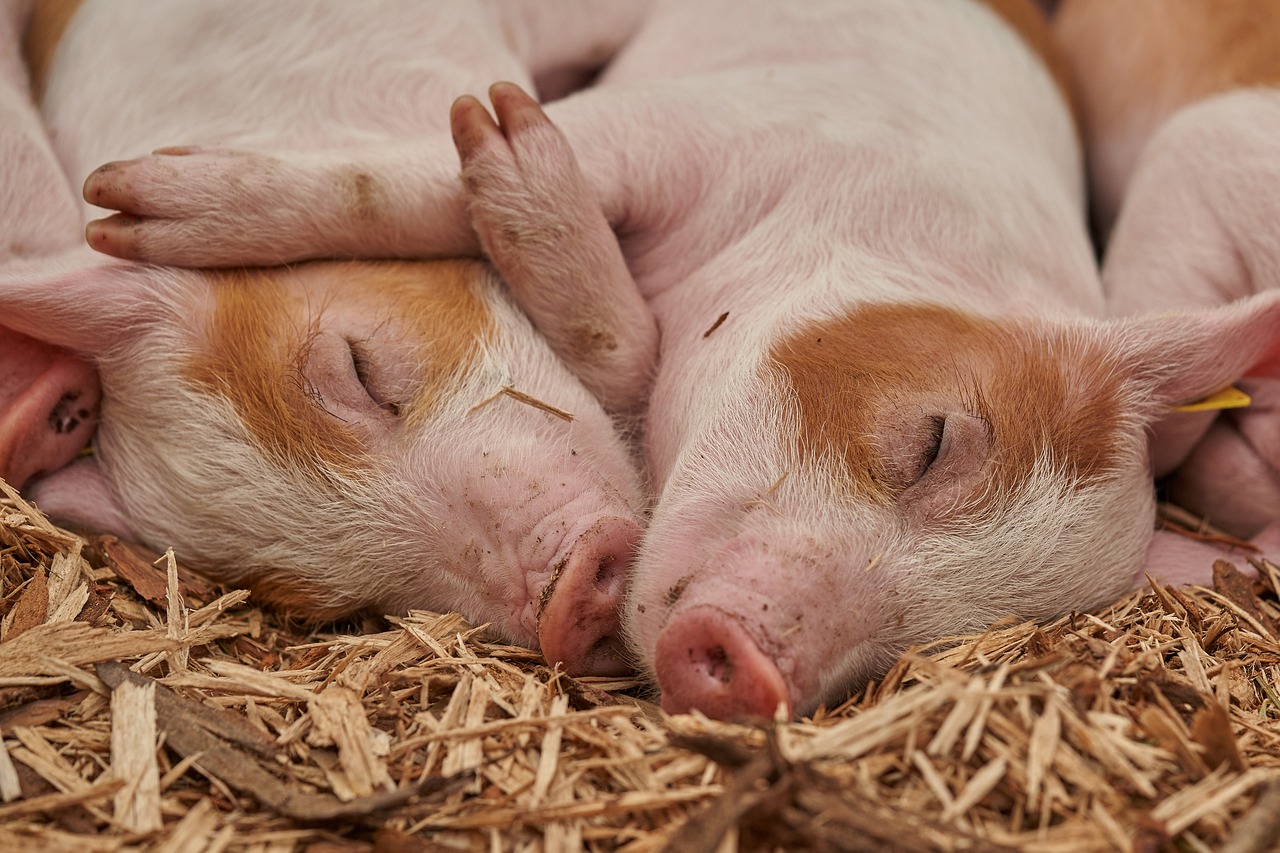
Lean hog futures posted mixed action across the board on Thursday, with front month gains of 20 to 42 cents and deferreds down a dime to 25 cents. The national average base hog price was reported at $76.27...

Cotton futures closed out the Thursday session with gains of 49 to 190 points. The dollar index was back up 78 points, with crude oil futures $1.06/barrel higher. Export Sales data showed cotton bookings...

Live cattle futures were up 35 cents to $1.67 across the board, led by the nearbys. Cash trade has yet to kick off this week. This morning’s Central Stockyards online Fed Cattle Exchange auction showed...

Soybean futures rounded out the Thursday session with a bout of weakness, as contracts were fractionally lower across the front months. CmdtyView’s national front month Cash Bean price was down 3/4 cent...

The wheat complex posted losses across the board on Thursday. Chicago SRW futures were down 8 ½ to 10 1/4 cents on the day. KC HRW saw losses of 11 to 14 cents across the board. MPLS spring wheat posted...

Iris Energy offers prime investment potential in the Bitcoin industry backed by AI investments, record sales, and bullish analyst ratings.

The Nov WTI trading session settled at 71.16(+1.28) , had a high of 71.53, a low of 69.13. Cash price is at 70.90 (-0.31), while open interest came in at 332,769. Higher on the day by +1.83% CLX traded...

General Mills GIS stock is up +15% this year and investors may be wondering if the consumer food giant can continue to reward its shareholders. Able to exceed top and bottom line expectations for its...

This growth stock has doubled this year but is way below its highs made in July.

