Futures Market Overview
Sun, Aug 2nd, 2026
Futures News
More News%20by%20CL%20STOCK%20via%20Shutterstock.jpg)
Vanguard isn't just a low-cost slop shop. It puts out high-quality ETFs for reasonable costs. These are three of the best.

Retirement conversations often revolve around the "magic number" you'll need to have saved. But to be truly ready, you also need to understand how that number will be spent.

Successful investing isn't about making better predictions—it's about following a better process. Learn the systematic framework used to build a disciplined stock and option income portfolio, from screening...
Selecting the right entry week is only one part of timing a seasonal spread. This article explores why the front-month contract can have a significant impact on historical profitability, consistency, and...

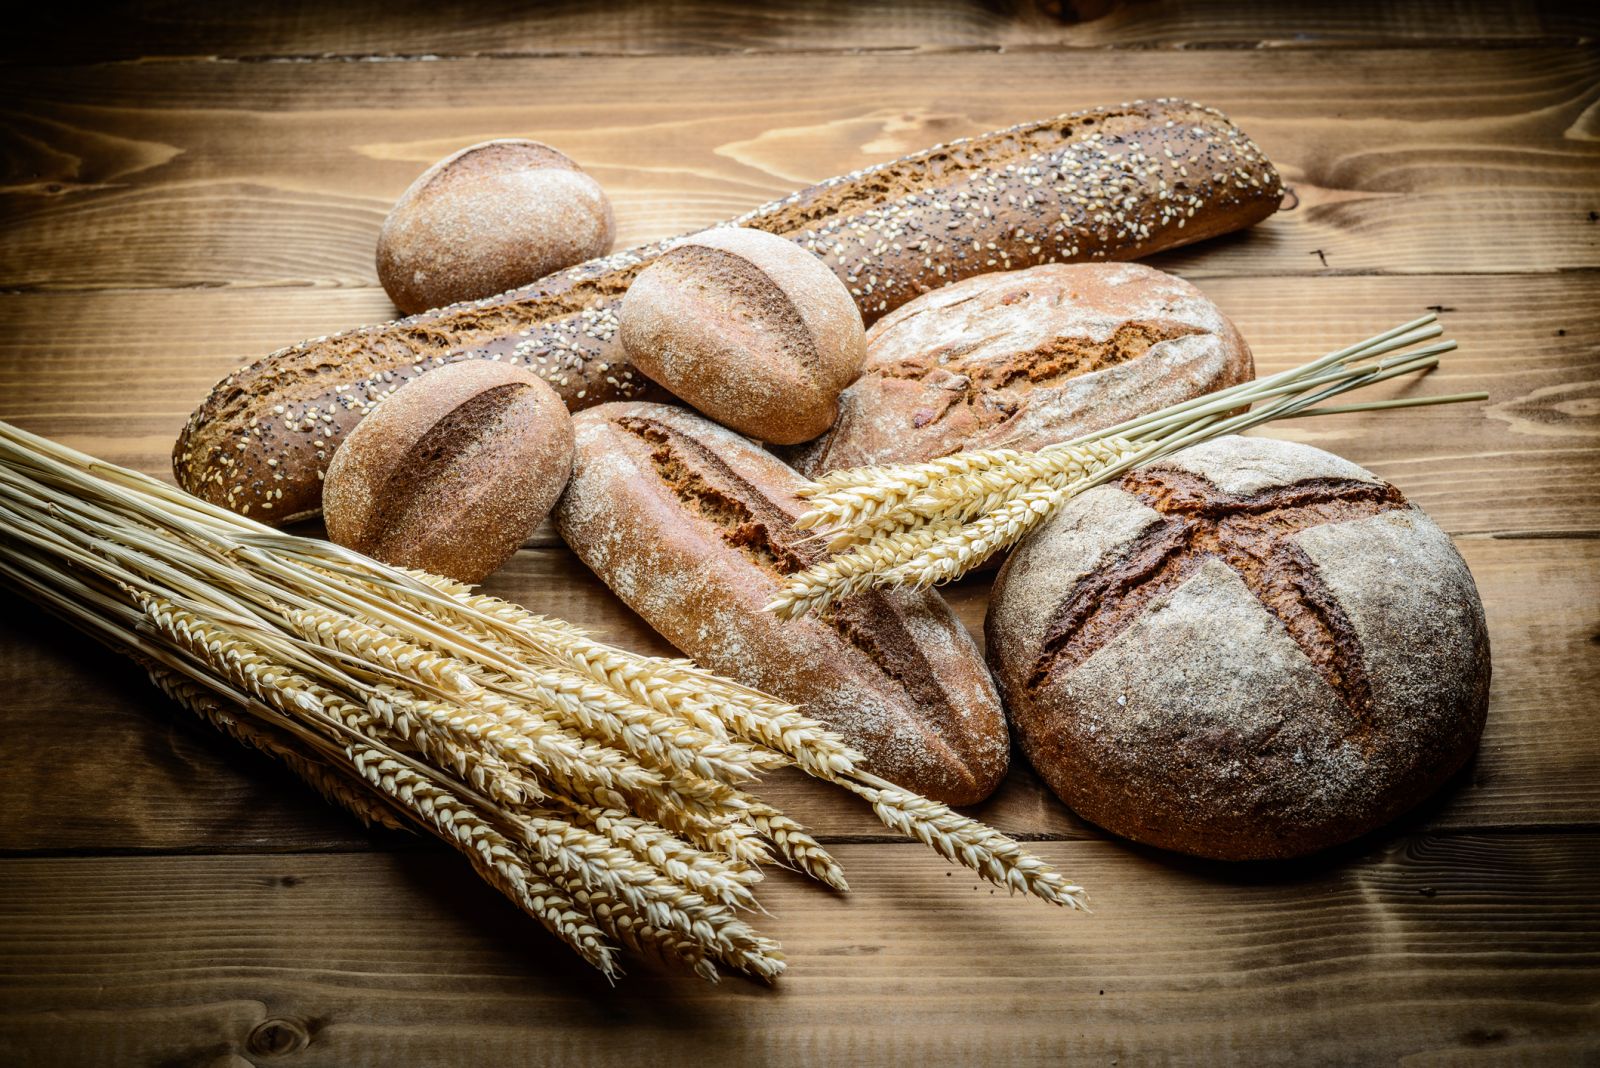
The wheat complex fell into the weekend, with losses across the three exchanges as money was coming out at the end of the month. Chicago SRW contracts were down 18 ¼ to 24 ¼ cents at the close. September...

Live cattle futures were mixed, with contracts up 52 cents to 20 cents lower. August was up $4.67 this week. USDA picked up cash trade at $232-233, with some up to $235. Feeder cattle futures extended...
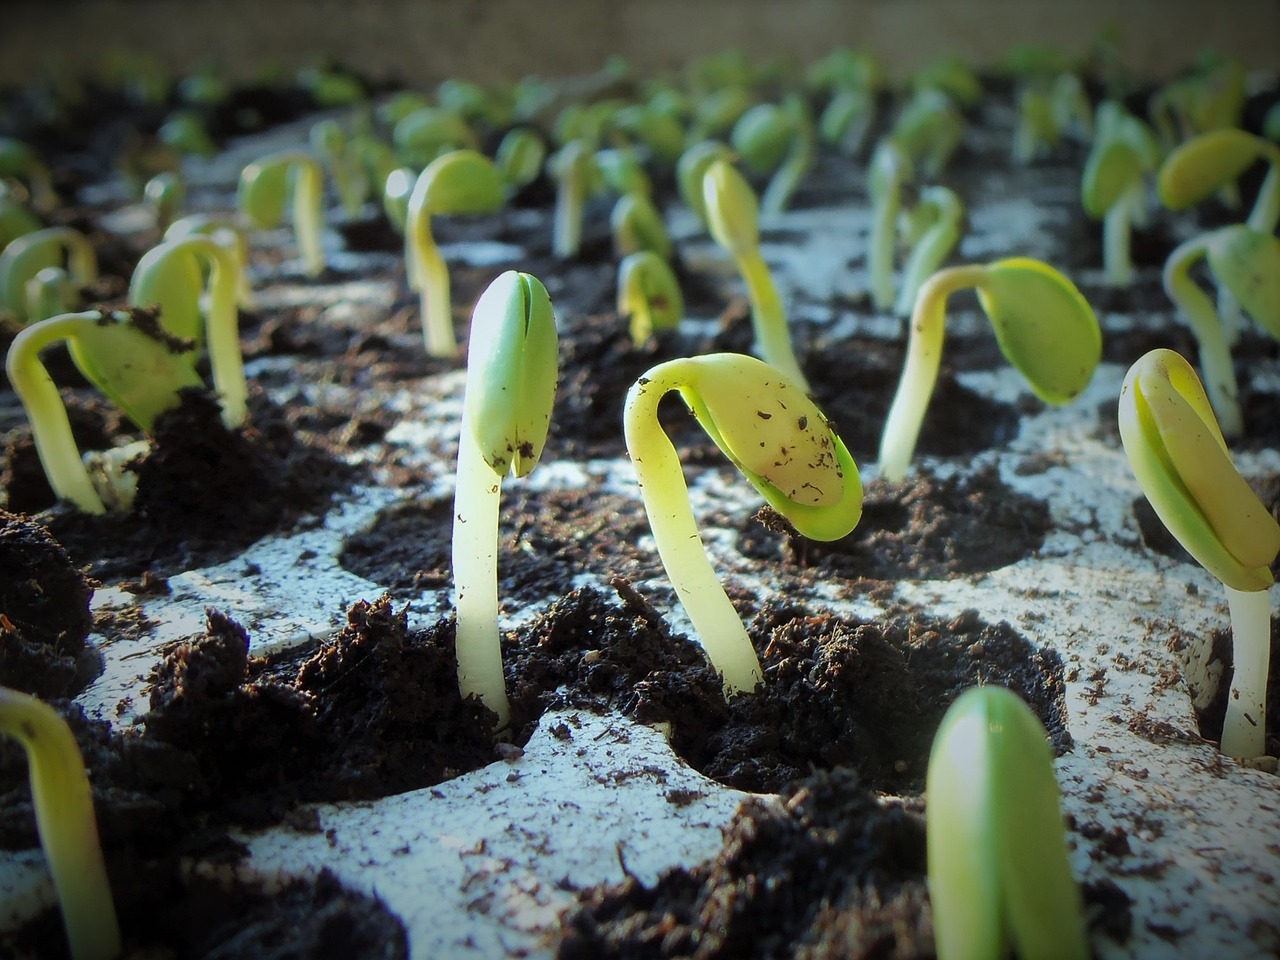
Soybeans posted 1 to 5 ¼ cent losses across most contracts on Friday. August was down 76 cents on the week, with November dropping 66 cents. November still managed a 43 ¾ cent gain on the month The cmdtyView...
Premium commodity data, news and analysis from Barchart.Learn More.

/AI%20(artificial%20intelligence)/Ai%20chip%20by%20Quality%20Stock%20Arts%20via%20Shutterstock.jpg)

/A%20hand%20holding%20a%20phone%20with%20the%20Reddit%20logo_%20Mamun_Sheikh%20via%20Shutterstock_.jpg)
/Seagate%20sign%20on%20the%20building%20atits%20operational%20headquarters%20By%20JHVEPhoto.jpeg)
/Apple%20logo%20on%20store%20front%20by%20frantic00%20via%20iStock.jpg)