Options Volatility
These days, I’ve come to think of volatility as the fear meter of the options market. More fear and uncertainty there is, it leads to higher volatility, higher premiums, and higher risk. Calmer markets lead to lower volatility, lower premiums, and lower risk.
Remember, volatility is constantly changing. Headlines, economic data, earnings reports, geopolitical shocks, and general market sentiment can drive it up or down. What might look like a perfect trade setup right now could turn into a volatility trap, just like that, leaving you with no time to react.
That’s why it’s important to understand volatility as a whole, not just the number you see on your broker’s trading portal.
Other Volatility Metrics
Aside from historical and implied volatility, there’s also other volatility metrics.
First, there’s IV Rank, which measures the current IV's position compared to the past year, or more specifically, where it sits in the range. For example, if IV is high now compared to the past, IV Rank will also be high, meaning premiums, or options prices will be higher than usual.
![]()
There’s also the IV Percentile, which tells you how often IV has been lower than its current value over the past year.
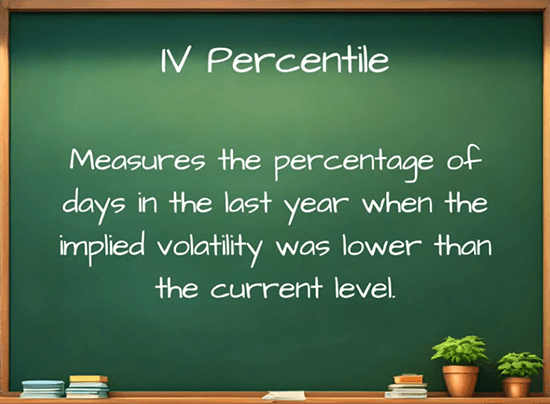
So, how do you use IV Rank and Percentile in the context of a trade? Well, IV Rank helps you identify extreme volatility conditions, while IV Percentile tells you how frequently those conditions have occurred.
There’s also IV over HV, which is sometimes referred to as implied vs realized volatility.
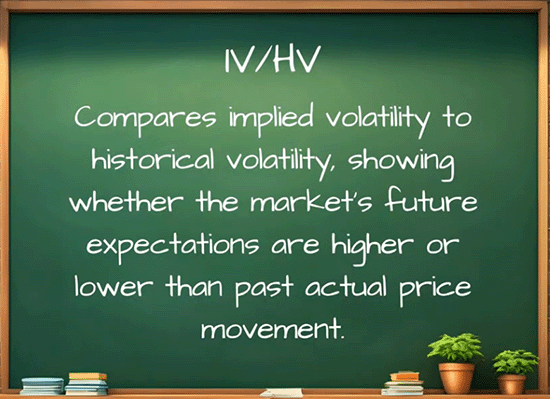
A value close to 1.0 suggests that the options market is pricing in future volatility roughly in line with recent historical or realized moves, indicating a balanced environment where neither buyers nor sellers have a strong edge.
High IV/HV ratios usually suggest options are overpriced and better for selling ,while low ratios mean cheaper premiums.
Finding Volatility Information
So, how do you use volatility for trading? Right off the bat, in general, higher volatility favors sellers while lower volatility is better for buyers. But it’s actually a touch more complicated than that.
In order for you to be successful in your trade, we need to consider where volatility is headed where it currently sits within its 1-year range, and how often it has been there. In other words, Volatility Trend, IV Rank, and IV Percentile. That’s a lot of numbers, and I get it, not everyone has the time to sit down and calculate these values.
Thankfully, Barchart already does all the work for you. Through its new P&L charting feature, you have access to every volatility metric you might need to consider a trade.
To get to the new P&L feature, go to Barchart.com, then search for any stock. Let’s use Palantir in this example.
Palantir’s been in the news a lot, the stock has skyrocketed, and continues to defy logic. And say you want to get in on the action by buying a call on Palantir. You can go to the left-hand navigation panel and click Long Call/Put under Option Strategies.
You’ll immediately see a list of potential long call trades for the closest expiration date. You can change the expiration date by clicking the dropdown.
To access the P&L charting feature, click on the Profit/Loss Chart button, or the charting icon between the price and expiration date. You’ll see five tabs: Profit/Loss, Greeks, Expected Move, Volatility, and Trend. All these display critical information that can help you succeed in trading. For now, let’s stick with the fourth one, Volatility.
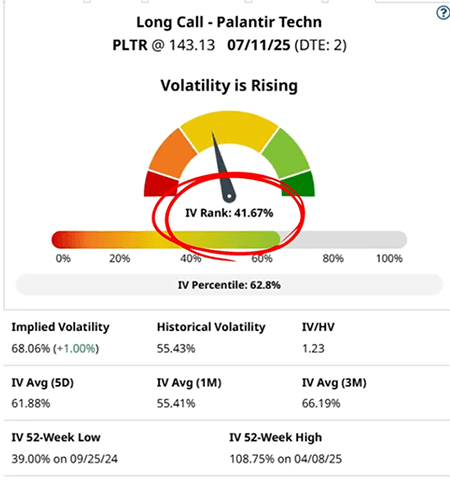
Immediately, you’ll see the IV Rank gauge, the horizontal IV Percentile plot, and numerical volatility values at the bottom. You can see other values like 5-day, 1-month, and 3-month volatility and the lowest and highest volatility values in the past 52 weeks.
But, the best features of the Volatility tab, I think, are the interpretations.
Interpretations can go from Very Low to Very High. It can also show if there’s notable movement in volatility, whether it’s rising or falling.
If the 5-day average IV is at least 5% lower than the 20-day average, the implied volatility over historical volatility ratio is below 0.91, and IV is falling, it signals a decline in volatility.
On the other hand, if the 5-day average IV is 5% higher than the 20-day average, and the IV/HV ratio is above 1.09 with a rising trend, volatility is increasing.
As we can see here, Palantir’s volatility is rising. Its IV rank is 41.67%, its IV percentile is 62.8%, while its current IV is 68.06%. Based on the data, IV is above-average but not at extreme highs and has been lower than it is now for more than half of last year. However, IV is climbing, which suggests that there’s growing interest, or at least uncertainty around PLTR, potentially ahead of earnings.
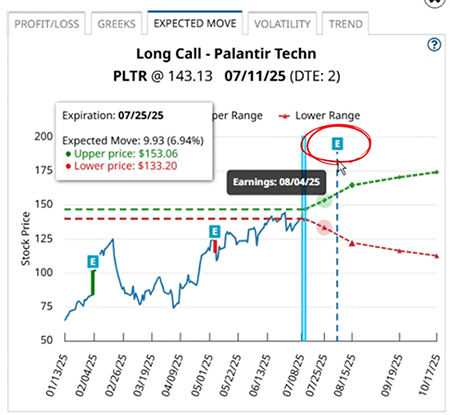
And if we switch over to the Expected Move tab and check the graph, we’ll see that yes, there is indeed an upcoming earnings report on August 4, which can increase volatility.
As you can see, every metric you might need for volatility is right here.
Ideal Volatility For Different Strategies
But how do you use it in a real-world trading environment? Well, it’s best to know what volatility metrics are good for what strategies. So let me show you.
Let’s start with long options. Buying options contracts is best done when volatility is low but rising. Perhaps when IV, IV rank, and IV percentile are all below 50% but with an upward bias.
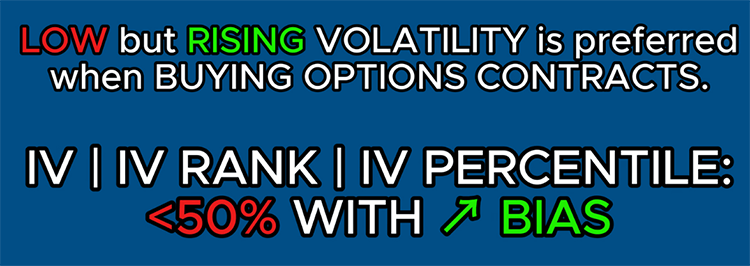
This allows you to spend less on the trade setup and potentially earn more as volatility spikes. This strategy applies to long calls and puts, which you can sell further down the line for ideally more than you’ve bought them for.
Of course, the risk here is that if the price moves against you, say you’re long on Palantir but it goes down instead, that high volatility is not going to do you any favors, as prices can move down fast.
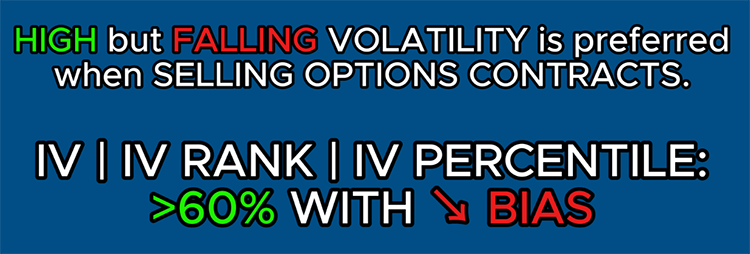
For short option strategies like covered calls or cash-secured puts, higher but falling IV usually works best. That means IV, rank, and percentile of above 60 or 70%, as these trade setups have the potential for richer premiums, and the falling IV will eat away at the options' values, allowing you to buy them cheap or let them expire worthless.
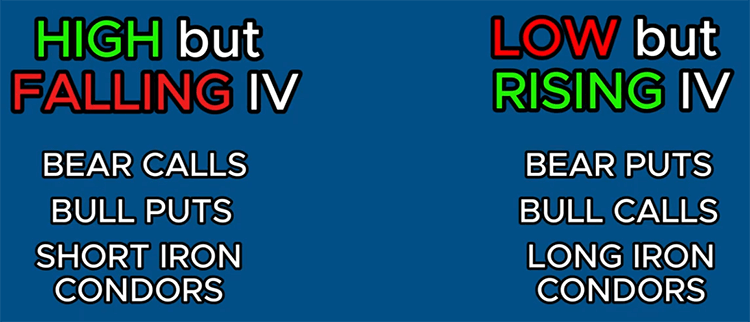
These ideal volatility scenarios extend to more complex trade strategies. For example, credit strategies like bear calls, bull puts, and short iron condors work well when IV is high and is falling while debit strategies like bear puts, bull calls, and long iron condors are better when IV is low and rising.-- Whichever strategy you choose, of course, will entirely depend on your outlook.
Finding IV Trades
Now, how do you find high or low volatility trades? Well, Barchart has a few quick and easy sections that you might be interested in.
So, let’s go back to the homepage, then click Options at the top, and you’ll see these four options under Volatility: IV Rank and IV Percentile, Implied vs Realized Volatility, Highest Implied Volatility, and %Change in Volatility.
Each of these sections allows you to find underlying assets and trades that display certain volatility traits that might fit your preferred strategy. Let me give you an example.
Say you’re looking to buy a call. So you’ll want an underlying that’s got a low IV, but rising IV. You can start by accessing Highest Implied Volatility, then going to the "Lowest" tab at the top. Here, you’ll see assets with the lowest implied volatility in the market.
I also like to consider volume, as higher volume means more liquidity. So, I’ll click the Volume column header, and the list will be arranged from highest to lowest volume trades.
And there you have it, the top five assets are Microsoft, AGNC, Apple, Altria Group, and Caterpillar - all well-known companies - and you immediately get suggested strike prices, bid and ask spreads, implied volatility, and delta values.
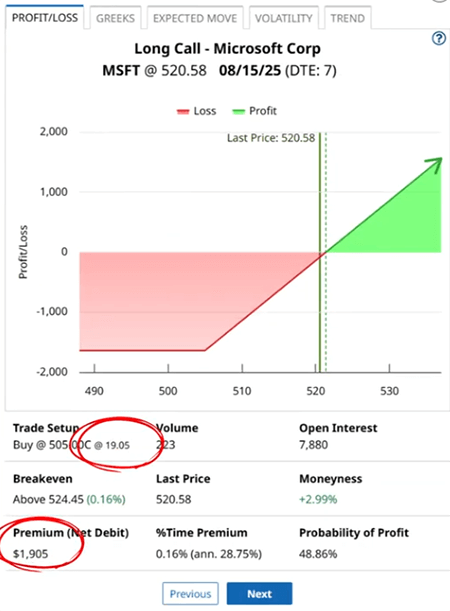
Let's say you're thinking about buying this at-the-money Microsoft call with the $505 strike that expires on Aug 15, or in about 37 days.
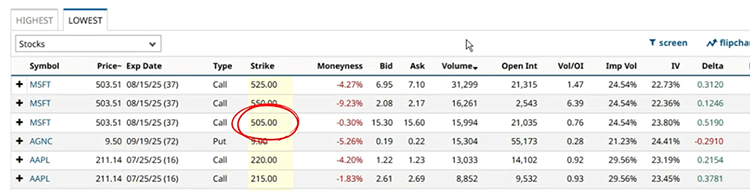
The premium is $15.60. So with this trade, you’ll want volatility to rise, so that the premium rises as well.
Fast forward a little, to say Aug 8, it's about a week before expiration, and the stock has moved up from $503 to $520. And your option? Well, now it's worth $19.05. If you sold it today, you’d make $3.45 or $345 per contract.
Common Trading Mistakes With Volatility
Now that you know how to look for trades, let’s discuss the most common mistakes new traders make when trading around volatility.
First, mistaking IV Rank and IV Percentile. Remember, IV Rank shows you the relative position of the asset’s current IV in a historical context, while IV Percentile indicates the percentage of time over the past year that IV has been lower than it is now. So, always use IV Rank to spot extremes and IV Percentile to spot consistency.
Next is buying and selling options at the wrong time. When going long, like buying a stock, you want to buy low and sell high, right? Well, the same works for options. You want to buy options when IV is low, or sell options when IV is high. Entering long positions when IV, IV Rank, and IV Percentile are already through the roof means you are overpaying. And selling options when IV is too low means you are getting lower premium while being exposed to the same risk.
Next, and this one’s important, is applying the same volatility yardstick for all trades and ignoring natural volatility shifts. I’m talking about applying hard rules to your trading like, “all IV above 50% is immediately high” or “I’m not buying options with more than 30% IV.”
As I said earlier, IV is a moving target, and it has complex relationships with other option metrics like Greeks, time to expiration, market events, the stock’s price movement, and the company itself. What’s “high IV” for Coca-Cola, a typically non-volatile stock, might be completely normal for Tesla.
And don’t forget that volatility can expand after entry, so setting rigid thresholds can cause you to miss profitable opportunities when conditions shift.
Wrap-Up
Trading around volatility isn’t just for pros. It’s a skill that anyone can learn. By mastering tools like IV Rank, IV Percentile, and IV/HV ratios, you can better time your entries, choose the right strategy, and avoid some of the most costly mistakes options traders make.
Whether you're selling covered calls during periods of high IV or buying long calls in periods of low IV, knowing the context gives you a serious edge. And thanks to platforms like Barchart, you don’t have to do the heavy lifting. All you need to do is click a couple of buttons, and you’re there.
But what’s theoretical knowledge without actually going out and making the trade?
I challenge you to hop onto your favorite broker's platform, sign up for a paper trading account, and test what you’ve learned here today. Sell options when IV is high and buy when it’s low. Monitor the changes in IV, IV Rank, IV Percentile, and the underlying stock's price action, and see how those volatility conditions affect your P&L.
Then, when you’re good and ready, consider trading with real money. After some time, I’m sure your wallet will thank you for it!