Naked Put Strategies Made Clear
Net Credit, Break-Even, and Greeks at a Glance
Have you ever wanted to get paid to potentially own your favorite stocks at a discount? Well, you can by selling naked puts. I’ll break down the naked put strategy, how you can earn income from it, and how Barchart’s new P&L charts can help you make better trades, faster.
What Is a Naked Put?
First, let’s get the definitions out of the way.
A put option is a contract that gives the holder the right to sell an underlying asset at a specific price, known as the strike price, at or before a specified time, which is the contract's expiration date. The buyer pays a premium for this right.
On the other side of the trade, we have the trader selling the put option. A naked or short put is an options trading strategy in which the trader sells or writes a put option without having the cash stashed away to potentially buy the asset. The trader also doesn’t own the underlying asset.
Put option seller enters a “short” position and receives a premium from the buyer in exchange for the obligation to maybe buy the underlying asset at the strike price if the option is exercised - this is called assignment. A trader selling naked puts must have enough margin to cover the purchase of the underlying security if assigned.
Now, I want to highlight two points in that definition. First, you receive a premium by selling a put option, which is also your net credit and maximum profit. And, if done correctly, it could potentially be an excellent source of income.
Next, should you be assigned, you need to have the margin to buy 100 shares of the underlying asset, for every contract you sold. This also presents an excellent opportunity to buy quality stocks at a lower price than when you sold the naked put.
Let me show you an example of how it works. Let’s say XYZ is trading at $95, and you sell an out-of-the-money put with a $90 strike that expires in 30 days, expecting it to stay above the strike price by expiration. You receive $3 per share for that trade. And since options contracts represent 100 shares of the underlying stock, you’ll get $300 total.
After 30 days, let’s say XYZ stock is still trading at $95. That means your short option expires worthless, and you to keep your $300 in full with no further obligation.
Now, if the stock instead goes down to, say, $85, you’ll be assigned - which means you’ll buy 100 XYZ shares for $90 each - even though the stock is worth $85. But - you still got the $300 initial premium, and you can keep your 100 shares and wait for them to go up in value. However, the lower the stock price goes, the bigger the potential loss if you decide to sell the shares right after assignment.
This is why I always recommend only selling put options on high-quality stocks you’d like to own.
Profit Mechanics - Net Credit & Breakeven
Now let’s talk about two of the most important concepts when trading naked puts: net credit and the breakeven price.
Like I explained earlier, when you sell a put option, you’re paid a premium as soon as the option is filled. That premium is what’s known as the net credit, and it's the maximum amount of money you can make on the trade. Your best-case scenario is that the option expires worthless, and you keep that premium in full. No shares get assigned to you, and the cash just stays in your account.
But, it’s also important to know the breakeven price - one of the most important considerations when trading options.
Say you sell that $90 strike put for $3. Your breakeven is the strike price, $90, minus the premium, $3. That’s $87. That means you don’t actually start losing money until the stock drops below $87. You're still ahead even if the stock falls between $87 and $90. Of course, you’ll need to factor in trading fees as well, so the breakeven price might be slightly higher with different brokers.
Intro to Barchart’s P&L Chart & Greeks
Now, let’s talk about a new and exciting feature on Barchart. The Barchart profit and loss display goes far beyond a simple chart. It’s a comprehensive interface that gives you everything you need to evaluate an options trade — from breakeven points and Greeks to volatility, trend momentum, and earnings-driven moves.
At the top, five key tabs organize the most critical trade components: Profit/Loss, Greeks, Expected Move, Volatility, and Trend.
You can access the feature by going to any stock, clicking on naked puts, and then clicking the chart icon beside the expiration date.
Each offers a unique perspective to help you make more informed trading decisions. Let’s go through each one by one.
First, the Profit/Loss chart tab gives you a visual breakdown of potential outcomes based on the underlying stock’s price. You can hover your mouse over the chart to view specific price levels and see exactly where your trade would land.
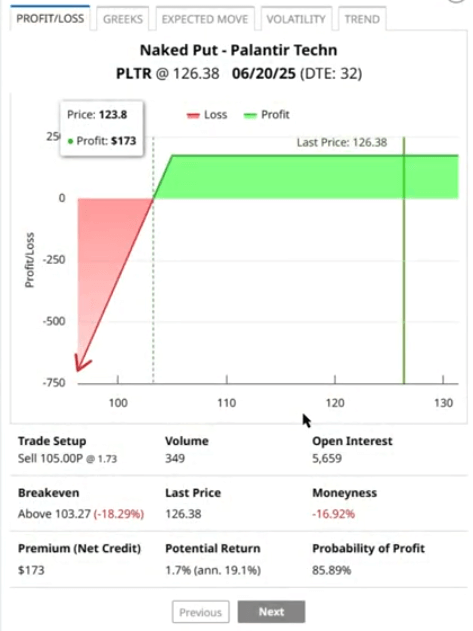
A dashed green line highlights your breakeven point, while a solid green line shows the current price for quick context. Below the chart, you'll find a detailed summary of your trade setup. This includes the Trade Structure, outlining the pricing and positioning of each leg, and the Breakeven, which shows the exact price the underlying needs to hit for the trade to be profitable, plus how far off the current price is from that target.
A positive value means the stock is below breakeven, while a negative figure means it's above. For single-leg trades, Moneyness is shown as the percentage distance between the last price and the strike price, displayed conveniently beside the last price. Lastly, the Outlook section gives you essential metrics for evaluating the trade, including return on premium, max profit and loss, risk/reward ratio, and the probability of profit or loss.
Interpreting the Greeks in Naked Puts
Now, let’s talk about the Greeks. Options Greeks are a set of metrics used to measure different types of risk and sensitivity in options trading—and they’re essential for understanding a trade’s risk profile.
For single-leg trades, you’ll see individual values for Delta, Gamma, Theta, Vega, Rho, and Implied Volatility (IV). For multi-leg trades, the platform shows IV skew, net Greeks for the entire position, and ratios based on those net values. These readings aren’t just numbers—they help highlight your directional bias and expose areas of potential risk. I like to use Greeks as a guide to navigate uncertainty, especially since strategies like selling naked puts can carry significant risks.
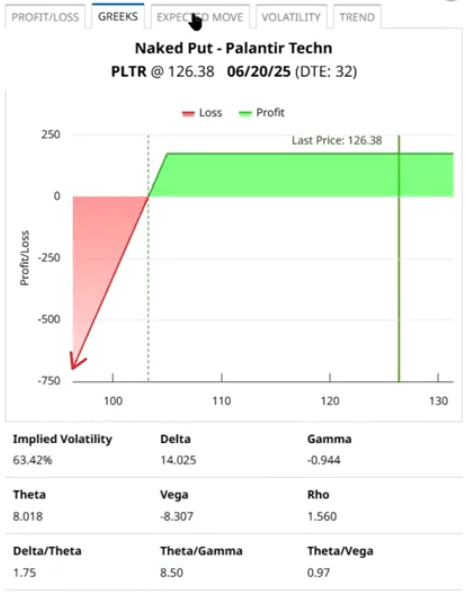
Now, let’s cover the Greeks you need to consider for naked puts. First, let’s talk about delta. Delta measures how much an option’s price is expected to move for every $1 change in the underlying asset. Short puts have a positive delta, typically between 0 and +1, because the position benefits when the stock price rises. The higher the stock climbs, the more likely the put expires worthless, allowing you to keep the full premium.
So, if you sell a naked put with a delta of +0.30, that means the option’s premium should decrease by 30 cents for every $1 increase in the underlying stock — which is exactly what you want as the seller.
But, delta also gives us a rough estimate of the probability that the option will expire in the money. So, if your short put has a delta of +0.25, that implies a 25% chance of finishing in the money, and a 75% chance of expiring worthless, which put sellers aim for.
The next Greek has to do with time. Since options are time-bound contracts, all things being equal, their value declines as each day passes. This phenomenon is known as time decay, or theta, and it accelerates as expiration approaches. In other words, the closer the option’s expiration, the faster it loses value.
This is important information when selling any kind of option, because the higher the theta, the faster that option erodes in value — which increases your chances of the put expiring out of the money and unassigned.
Now, you may have heard that some traders prefer selling puts with shorter expirations, like weekly or even 3-day contracts, to maximize theta decay. While that can work once or twice, it’s typically not a strategy that can be repeated over and over. It leaves you at risk of losses when prices suddenly drop. We’ve seen that happen recently with the volatility in early April 2025. Also, options with very little time left, like 0 or 1-day to expiry, will have limited premium to begin with, so the reward might not justify the risk unless you're very selective about your strike and underlying.
Expected Move
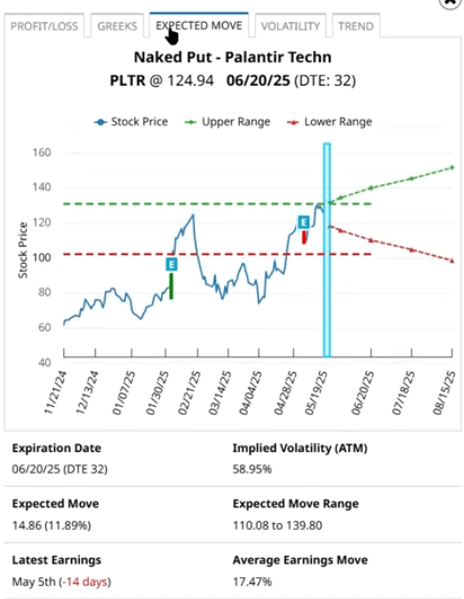
Now, let’s talk about the expected move. Expected move provides the theoretical range a stock is expected to trade in over a given period. It’s calculated by taking 85% of the price of at-the-money long straddles, then adding and subtracting that from the stock price to get the upper and lower bounds. But you don’t need to do the math yourself.
With Barchart, we show you the Expected Move visually. The graph displays projected price ranges across different time frames, along with key details like expiration date, days to expiration (DTE), and implied volatility, which is derived from the . At the top, you’ll also see a 6-month historical price chart, helping you compare past movement with the current projection. When available, past and upcoming earnings are overlaid to give you further context.
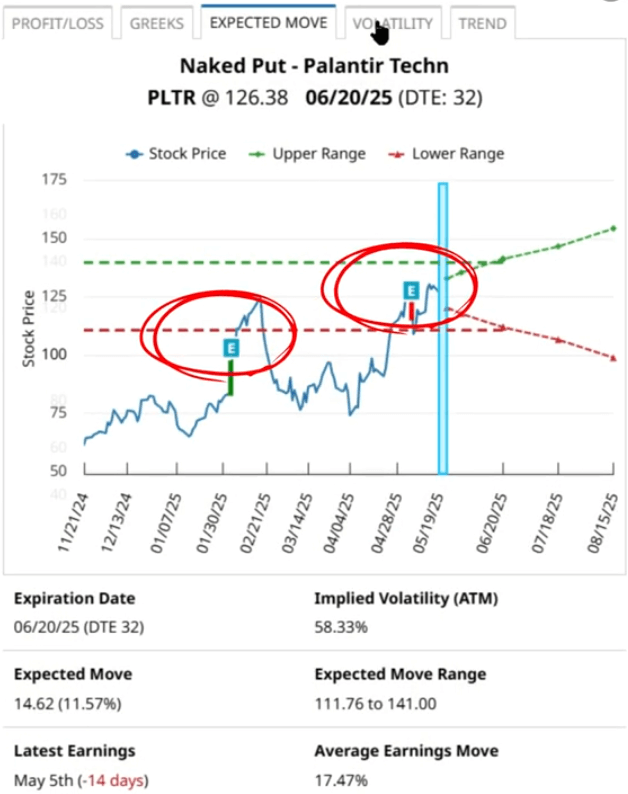
When selling naked puts, a common approach is to choose strike prices below the lower end of the expected range. This positions your trade outside the market’s anticipated move, increasing the chance that your put expires worthless. And with all this context in one place, you get higher confidence in whether your trade idea aligns with the market’s outlook.
Implied Volatility
Next, let’s talk about implied volatility or IV. IV reflects the market’s expectation for how much a stock might move over a set time frame—but not which direction it will move. This matters because higher IV leads to higher option premiums, which is great for selling puts, especially around events like earnings, major announcements, or economic uncertainty.
But IV can be tricky—it often spikes before a big event and drops sharply once the uncertainty clears. This drop is called volatility crush, and it can reduce the value of your position fast. That’s why it’s best to target trades when IV is elevated but falling—you collect a richer premium with less risk of that post-event decline.
Barchart makes this easier with built-in IV insights. The IV figure is based on the nearest monthly option with at least 30 days to expiration. You’ll also see IV Rank and Barchart’s interpretation, categorized from Very Low, under 10, to Very High, or 91 and above. Additionally, a horizontal IV percentile plot shows how often IV has been lower over the past year, helping you quickly spot extremes.
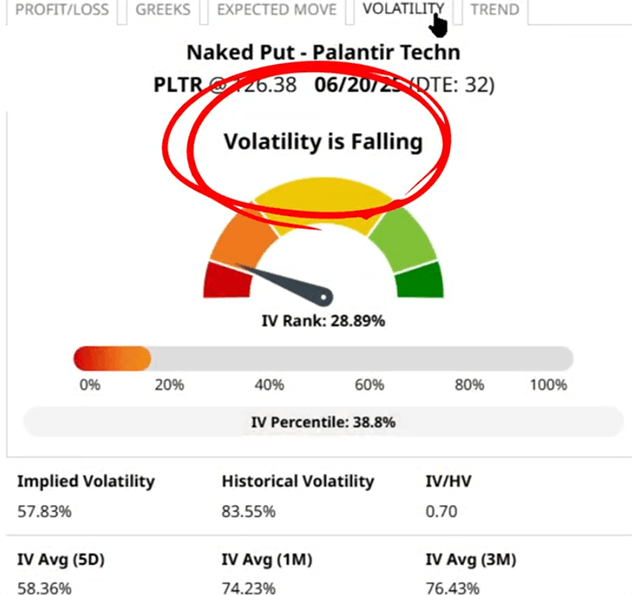
Barchart also factors in short-term volatility trends. If the 5-day average IV is at least 5% lower than the 20-day average, the implied volatility over historical volatility ratio is below 0.91, and IV is falling, it signals a decline in volatility. On the flip side, if the 5-day average IV is 5% higher than the 20-day average, and the IV/HV ratio is above 1.09 with a rising trend, volatility is increasing.
For credit trades like naked puts, high IV with falling volatility is ideal. Below the chart, you’ll also find detailed volatility stats: current and historical IV, their ratio, rolling averages, and the 52-week high and low. All of this gives you a clear edge in evaluating whether IV favors your trade setup.
Now, let’s jump over to the Trend tab, where you can quickly gauge the stock’s anticipated direction. You’ll see color-coded arrows representing Barchart’s opinion strength for short-, medium-, and long-term timeframes based on the 20-day, 50-day, and 100-day moving averages.
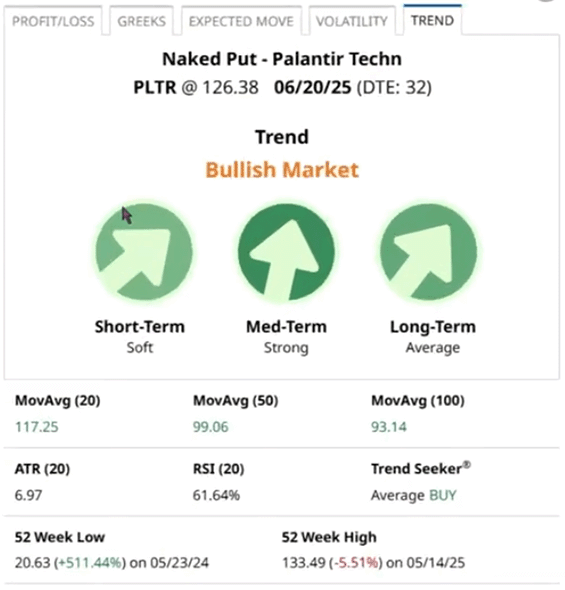
Green means bullish, red means bearish, and the angle of the arrow shows signal strength or how far the price has moved from its average compared to historical norms. A Strong reading means the price is well above or below the average, and the trend is likely to continue. This information is critical for naked puts since you want the price to stay above your strike.
Below the arrows, you’ll find the actual moving average values, color-matched for quick reading. You’ll also get additional tools like ATR or Average True Range, which reflects 20-day price volatility and can help set price targets or stops, and RSI or Relative Strength Index, which shows momentum and helps identify overbought or oversold conditions.
Barchart also includes Trend Seeker, a proprietary signal that uses volatility, wave theory, and the 50-day EMA to generate Buy, Sell, or Hold calls. And for added context, the 52-week highs and lows are listed to help identify potential support or resistance levels.
Altogether, this tab gives you everything you need in one place. No jumping between charts adding indicators left and right. Just check the details you need for your trade.
Building a Smart Naked Put Trade
Now, let’s take everything I’ve discussed — Barchart’s P&L graph, options greeks, IV, and expected move, and apply it to a real trade.
So, the first step is choosing your underlying asset. Remember, short put assignment obligates you to buy 100 shares of the underlying, so make sure you choose a stock that you’d want to own. For this example, let’s choose Palantir. I’ll go to its profile page, then click naked puts on the left hand sidebar.
Now that I’m on the results screen, I’ll choose an expiration date. Somewhere between 30 to 45 days to expiration (DTE) works well for naked puts.
The next step is to choose the strike price. To guide us with that decision, let’s open up the P&L chart and go to expected move. As we can see here, Palantir stock is expected to trade between between $139 and $110 by June 20.
So, let’s choose a strike price below $110. Maybe $105. So close up the P&L panel, then go to the strike price field, and type in 105 and hit apply.
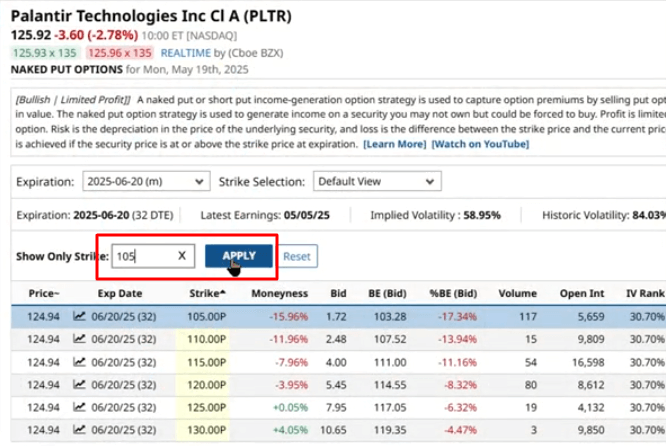
And there we have it. One option trade. Now, let’s review all the trade details. This naked put has a $105 strike price, expires in 32 days, and premiums are $1.73 a share, or $173 per contract. That is your net credit. Your breakeven price is $103.27, calculated by subtracting your net credit from your strike price.
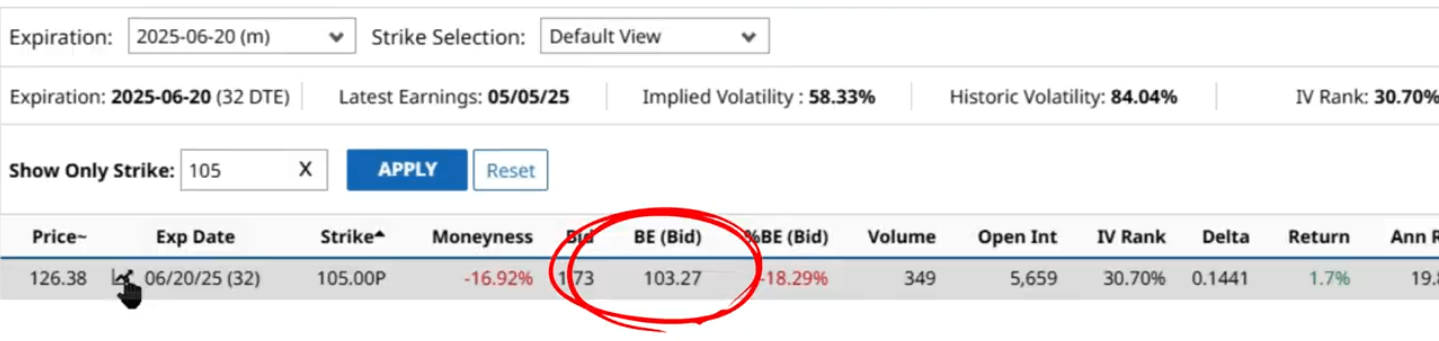
IV rank is at 29%. Delta is at 0.14, which gives us around an 86% chance of the option expiring out of the money. Probability of profit, a separate metric, agrees at around 86%.
Now, let’s open up the P&L chart again, then go to Greeks. Theta is at around 8.01 - which means if all things are equal, the trade will lose 8.01 cents a day until it expires.
Then we can check the Trend tab and see that most technical indicators are pointing to a bullish movement across all periods.
What Happens After Entry?
Once you sell your naked put and have received the net credit in full, do you just sit back and look for the next trade?
Of course not. A big part of success in option trading is monitoring and managing your positions. For naked puts, that means checking the underlying’s trading price to see if it gets close to your strike price.
So, let’s say it does. By day 25, Palantir drops to $106, and for you, that’s a little bit too close for your comfort. So what do you do?
Well, you can roll your down the strike price of your put, or you can roll the option’s expiration forward. For the former, what you’d have to do is buy to close your $105-strike short put then sell to open another put at, say $102. This might impact your profitability, but it’s often a better alternative than getting assigned. Unless of course, you want to get assigned. If that’s the case, then by all means, let the option expire in the money.
For rolling puts to a later expiration, it’s the same deal: buy-to-close the $105 short put, then sell-to-open another one with a longer DTE with the same strike. You can also change to a lower strike price if you want.
You can also close the trade entirely, which means buying to close the position and then moving on to other trades. Depending on the circumstances, you might still walk away with profits, and you avoid the risk of assignment altogether.
Now, when I’m selling options, I almost never let my trades go to expiration - this is to avoid the risk of unexpected assignment. Typically, I take profit at 70 or 80% of the original premium. That means that when I see the option price drop to about 20 to 30% of my initial premium, I buy to close the position.
In the case of the Palantir example, that means I’d look to buy to close the trade once the price of the option drops to around $0.34 to $0.51 cents. That means I crystallize most of my premium, and I don’t have to worry about assignment.
Some brokerages also allow traders to use stop-losses. This is particularly important in selling options, because you’re exposed to significant downside risk if the underlying’s price plummets below your strike price.
I often set a stop to 1.5 or 2 times my initial premium. So, in this example, if the price of the option trades between $2.56 and $3.42, which represents 150% and 200% of the net credit, I close the position and take the loss.
But again, you can ignore all of these loss-mitigation strategies if you want to buy the stock and have the funds to do so.
Summary: Why This Tool Elevates Your Naked Put Game
Before Barchart’s new P&L and Greeks tools, trading naked puts meant doing a lot of manual work such as calculating breakeven prices, checking deltas, monitoring time decay, and trying to visualize risk and reward all in your head or on a spreadsheet. It worked, but it was time-consuming and prone to error.
Now? It’s all right in front of you. With just a few clicks, you get instant insight into the potential outcomes of your trade. The P&L chart gives you a crystal-clear visual of your risk and reward zones, while the Greeks tab helps you time your entries and exits more precisely. No more guessing whether your theta is high enough or if your delta gives you good odds — it’s all there.
Also this tool doesn’t just save time — it sharpens your strategy. You’ll make more confident decisions and avoid common mistakes that can eat into your profits.
I’ve got a challenge for you: have a look at two or three naked puts using Barchart right now. Play with different strike prices and expiration dates. Compare the charts and see how the Greeks shift. Then, use your brokerages paper trading account to test out your skills.
The more you use this tool, the more intuitive your trading becomes.