
SP 500 Futures Analysis & Targets
The chart is key to this analysis.
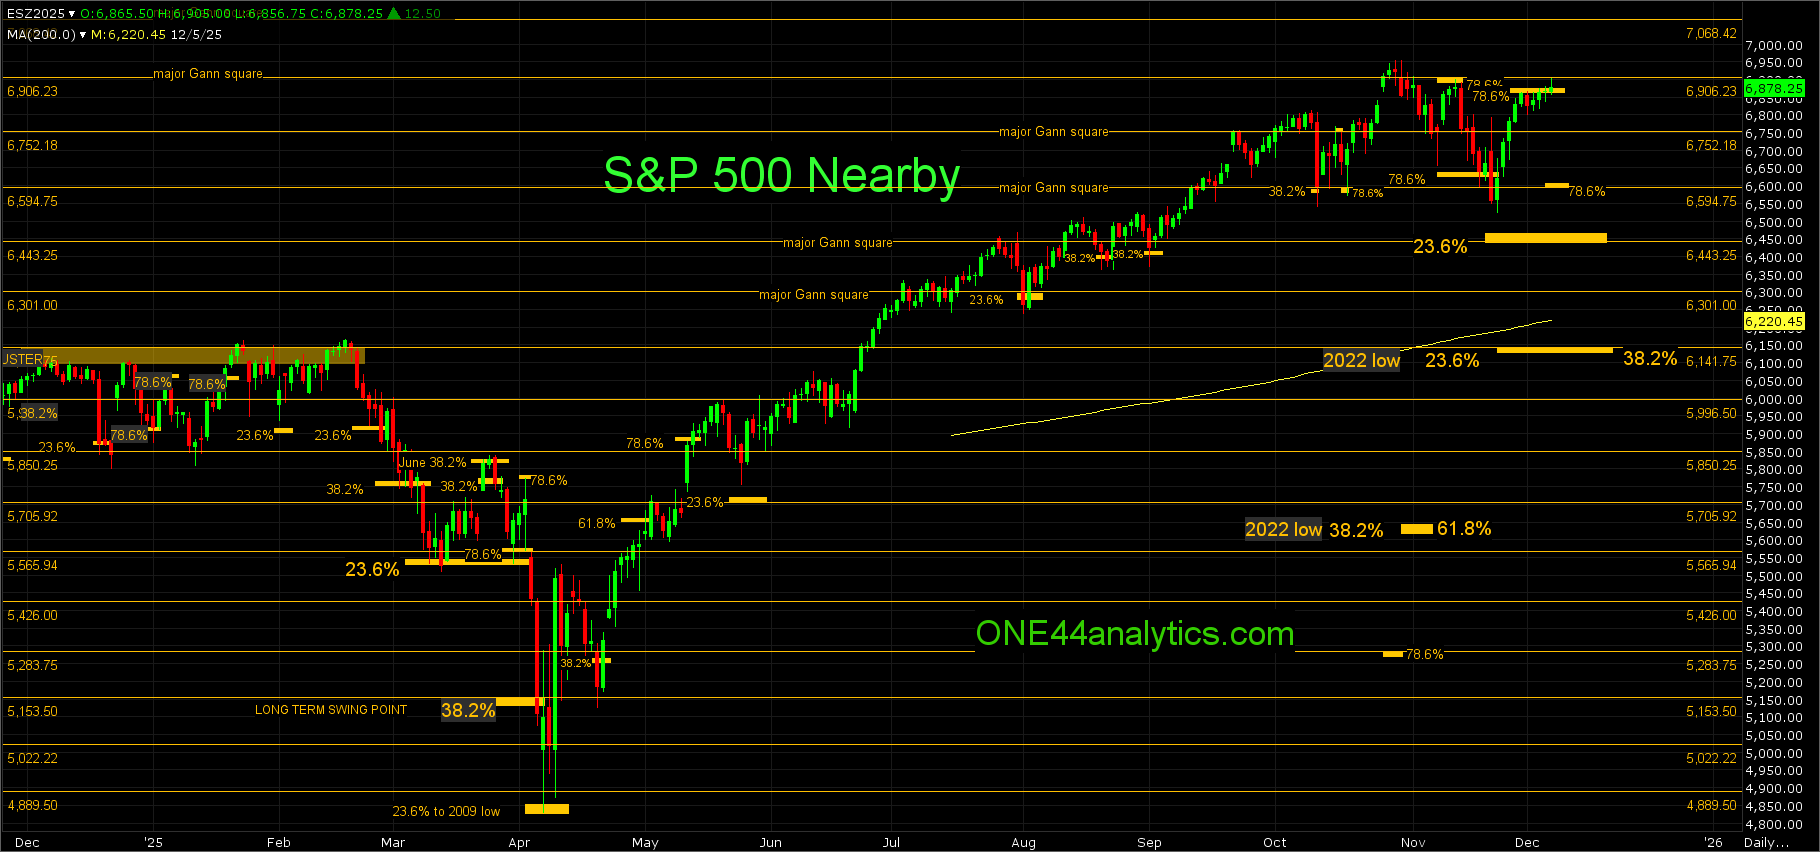
ESZ25
From last week,
The rally above 6686.00 (38.2%) hit the short term target area of 6864.00 (78.6%) and the 6906.25 major Gann square. A setback from here can go 78.6% the other way per the ONE44 78.6% rule. We will still watch for a trade up to the 6906.25 major Gann square and close back below 6686.00 as this can cause a sharp sell off too. The key level for the week will be 78.6% at 6686.00. Provided it did hit the 6906.25 major Gann square the 78.6% level below will move up.
Use 6686.00 as the swing point for the week.
Most of this week traded below the 6686.00 (78.6%) swing point and on Friday the rally fell 5 ticks shy of the 6906.25 major Gann square. It didn't close back below 6686.00 yet and this will again be the key level for the week. Getting right back below it can send it 78.6% the other way per the ONE44 78.6% rule. The Above remains the same and the Below has one slight change. For March the swing point for the week will be the 6906.25 major Gann square.
Use 6686.00 as the swing point for the week again.
Above it, a failure to make a new high between 6686.00 and the 6906.25 major Gann square can send this market sharply lower. Our long term target area is 7214.00 to 7230.00, this another cluster of major Gann squares just like the 6102.00 to 6142.00 cluster that sent the market down to 4850.00. Before then there is only one major Gann square left to look for resistance and then use it as the swing point when closed above at 7068.50.
Below it, the short term target is 78.6% back to the 11/21/25 low at 6609.00 per the ONE44 78.6% rule, there is also the 6594.75 major Gann square for added support. The longer term target area is 23.6% back to the 4/7/25 low at 6466.00 and the 6443.25 major Gann square. The long term target and long term swing point is 38.2% of the same move at 6141.75 this also lines up exactly with 23.6% back to the 2022 low and a major Gann square to make it an even more important level. The 200 day average is now 6202.00. There is one major Gann square before then to look for support and then use as the swing point when it is closed below at 6290.75.
You can sign up here for free Gold, Crude Oil, SP500 & Bitcoin Updates.
ONE44 Analytics where the analysis is concise and to the point
Our goal is to not only give you actionable information, but to help you understand why we think this is happening based on pure price analysis with Fibonacci retracements, that we believe are the underlying structure of all markets and Gann squares.
If you like this type of analysis and trade the Grain/Livestock futures you can become a Premium Member.
You can also follow us on YouTube for more examples of how to use the Fibonacci retracements with the ONE44 rules and guidelines.
FULL RISK DISCLOSURE: Futures trading contains substantial risk and is not for every investor. An investor could potentially lose all or more than the initial investment. Commission Rule 4.41(b)(1)(I) hypothetical or simulated performance results have certain inherent limitations. Unlike an actual performance record, simulated results do not represent actual trading. Also, since the trades have not actually been executed, the results may have under- or over-compensated for the impact, if any, of certain market factors, such as lack of liquidity. Simulated trading programs in general are also subject to the fact that they are designed with the benefit of hindsight. No representation is being made that any account will or is likely to achieve profits or losses similar to those shown. Past performance is not necessarily indicative of future results.

/A%20concept%20image%20of%20space_%20Image%20by%20Canities%20via%20Shutterstock_.jpg)
/A%20concept%20image%20of%20a%20flying%20car_%20Image%20by%20Phonlamai%20Photo%20via%20Shutterstock_.jpg)