The information and opinions expressed below are based on my analysis of price behavior and chart activity
Tuesday, November 11, 2025
January Soybean Oil – Bullish breakout or selling opportunity?
If you like this article and would like to receive more information on the commodity markets from Walsh Trading, please use the link to join our email list -Click here
Every morning, at about 8 AM CST, I post a short video highlighting where I see opportunities in the futures markets. You can view my most recent video here or you can visit my YouTube channel.
January Soybean Oil (Daily)
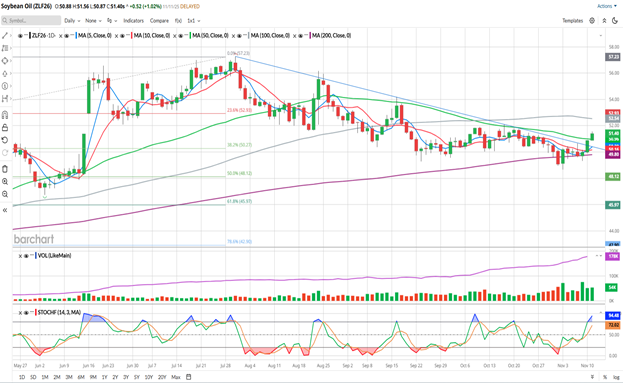
January Soybean Oil closed at 51.40 today, up 0.52 from Monday’s settlement. This market has posted 3 consecutive positive closes. Today’s price activity also saw prices close above the 50-day moving average (green, 50.96) for the first time since August 22nd. You might notice, by looking at the chart above, that this market had been grinding right along the 200-day moving average (purple, 49.80) starting on Thursday, October 30th, before rallying away from it this week. It would seem as if the long term-support has held. There’s a blue trendline drawn on the chart, from the July 30th and September 16th highs. You can see that Monday’s close was above that trendline, breaking through resistance, and today’s activity pushed the price up a bit further. Stochastics (bottom sub-graph) have ticked up into overbought territory this week, as the indicator has turned blue, but I wouldn’t qualify that as full-on overbought just yet. To my eye, we’ll need both readings in that indicator above 80.00, something that Bean Oil hasn’t done since late July, and then only briefly. The short-term moving averages depicted above, the 5- and 10-day, made a bullish crossover with Monday’s trade, reversing the bearish trend signal that had been in place since October 24th. The 100-day average (grey, 52.54) seems like a bullish target to my eye, which would put Bean Oil prices back up to roughly mid-September levels and above all of October’s trade. January Soybean Oil is also trading above the big, fat, round number of 50.00, which would seem like support to me. It may be tough to see on the chart, but prices have also recovered above the 38% Fibonacci retracement level, drawn from the contract lows to the contract highs. A move to the 50% level near 48.12, would seem bearish to me, but technically, that could also be deemed as support.
We’ve been lacking USDA data since the US Gov’t shut down last month, but it appears that the logjam in DC has been broken. It’s not “officially” re-opened as of this writing, but certainly seems headed that way. We will get a WASDE and Crop Production release on Friday of this week. That was planned before the Senate got their act together and it’s still delayed from the initial scheduled release of yesterday. November 10th. As we’ve been missing data since September, it will be interesting to see how the USDA puts together the information and how the markets react to it. Soybeans have been consolidating at roughly 1 ½ year highs for the past week or so. Soymeal has traded back a bit from the 8-month highs hit last week, but is also holding at elevated prices. Perhaps Soybean Oil can also pick up a bullish spark.
Aggressive and well-margined traders may do well to consider long futures positions. Perhaps an entry near the 50-day moving average at 50.96 could work well. I would suggest a protective sell-stop be placed at or below last Friday’s low of 49.32. From the 50.96 to last Friday’s low would be a risk or loss of $984 per contract before your commissions/fees. For an upside target, I might suggest the September high at 54.19. That would result in a gain of $1,938 per contract before your commissions/fees.
Less aggressive traders may do well to consider a long Call option position. January options expire in 45 days. A 51.50 Call, just 10 ticks out of the money, settled at 1.655 today, or $993 before your commissions/fees. You could buy 2 of them for less capital than you’d tie up on one futures contract. 2 of those options would give you a position “delta” of nearly 1.00 (delta on one of those calls is currently 0.49, x2 equals 0.98) If those calls go in the money, you’ll see that delta increase, giving you a potential gain better than 1 futures contract. By way of illustration, the 51.00 calls have a delta of .5360 and they’re just 0.40 in the money. The 50.00 Calls have a delta of 0.6749, and it increases the further in the money you go. I wouldn’t recommend placing a sell-stop in options, but rather set an alert at 50% of what you paid for the Calls and exit the trade if that alert is triggered. I would place a GTC order to exit the trade at 4x what you paid for the options, factoring in your commissions/fees.
If you like what you’ve read here and would like to see more like this from Walsh Trading, please Click here and sign up for our daily futures market email.
Every morning, at about 8 AM CST, I post a short video highlighting where I see opportunities in the futures markets. You can view my most recent video here or you can visit my YouTube channel.
January Soybean Oil (Weekly)
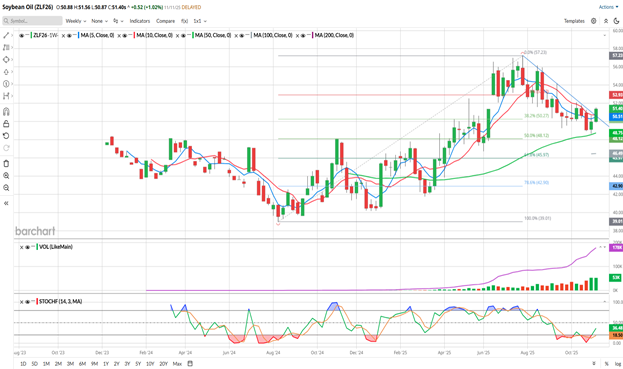
The weekly chart displayed above gives a life-of-contract view of the January contract. You might see the Fibonacci retracements, drawn from the contract lows in the 2nd week of August 2024 to the contract highs in the last week of July 2025. The 50% level (48.12) hasn’t been tested, but the 38% level (50.27) has been tested for the past 8 weeks, including this one. I know it’s only Tuesday and we still have 3 trading sessions and a delayed WASDE/Crop Production report on Friday to get through before this weekly bar ends. A weekly close above the blue trendline is bullish, in my opinion. Conversely, if this market fails to hold gains throughout the week and closes back below it, could be considered bearish. The 5-and 10-week moving averages are still in a bearish configuration, but the market is now trading above them and I would view those averages as potential support levels now. The 5-week is furthest (blue, 50.51) and the 10-week offers the nearest support (red, 50.73) to my eye. The 50-week (green, 48.75) almost got tested last week, but the low of last week stayed 10 ticks above it. And the 50-week is still inclined higher, indicating a market that is trending higher to me. Weekly Stochcastics (bottom sub-graph) are correcting out of an oversold condition that’s been maintained for the past 8 weeks. Two weeks of bullish prices does not change a trend, but if this continues, it’s quite possible that new contract highs are in the cards. You might notice that it took just 7 weeks to reach those highs when this market was rallying from 50.00 in the second week of June. I don’t think it will do it that quickly this time around, but we’ll have to stay tuned to find out. All-in-all, the weekly chart seems to show a market that gapped aggressively higher in June, set new highs late in July and has since retraced and found support. At least that’s what I see. What do you take away from it?
According to Barchart’s Seasonal Data, which can be viewed here, Soybean Oil tends to trade a little lower in November and December. However, rallies are not uncommon and we’re already up 2.42 this month. Keep in mind that while seasonals can be a guide, they are not hard and fast rules that the market MUST follow. To my eye, we’ve seen divergence this year between the seasonals and the actuals.
If you like what you’ve read here and would like to see more like this from Walsh Trading, please Click here and sign up for our daily futures market email.
Every morning, at about 8 AM CST, I post a short video highlighting where I see opportunities in the futures markets. You can view my most recent video here or you can visit my YouTube channel.
Jefferson Fosse Walsh Trading
Direct 312 957 8248 Toll Free 800 556 9411
jfosse@walshtrading.com www.walshtrading.com
Walsh Trading, Inc. is registered as a Guaranteed Introducing Broker with the Commodity Futures Trading Commission and an NFA Member.
Futures and options trading involves substantial risk and is not suitable for all investors. Therefore, individuals should carefully consider their financial condition in deciding whether to trade. Option traders should be aware that the exercise of a long option will result in a futures position. The valuation of futures and options may fluctuate, and as a result, clients may lose more than their original investment. The information contained on this site is the opinion of the writer or was obtained from sources cited within the commentary. The impact on market prices due to seasonal or market cycles and current news events may already be reflected in market prices. PAST PERFORMANCE IS NOT NECESSARILY INDICATIVE OF FUTURE RESULTS. All information, communications, publications, and reports, including this specific material, used and distributed by Walsh Trading, Inc. (“WTI”) shall be construed as a solicitation for entering into a derivatives transaction. WTI does not distribute research reports, employ research analysts, or maintain a research department as defined in CFTC Regulation 1.71.

/A%20concept%20image%20of%20space_%20Image%20by%20Canities%20via%20Shutterstock_.jpg)
/A%20concept%20image%20of%20a%20flying%20car_%20Image%20by%20Phonlamai%20Photo%20via%20Shutterstock_.jpg)


/Oracle%20Corp_%20office%20logo-by%20Mesut%20Dogan%20via%20iStock.jpg)