
Bullish - green stock market chart with arrow up day trade by Quality Stock Arts via Shutterstock
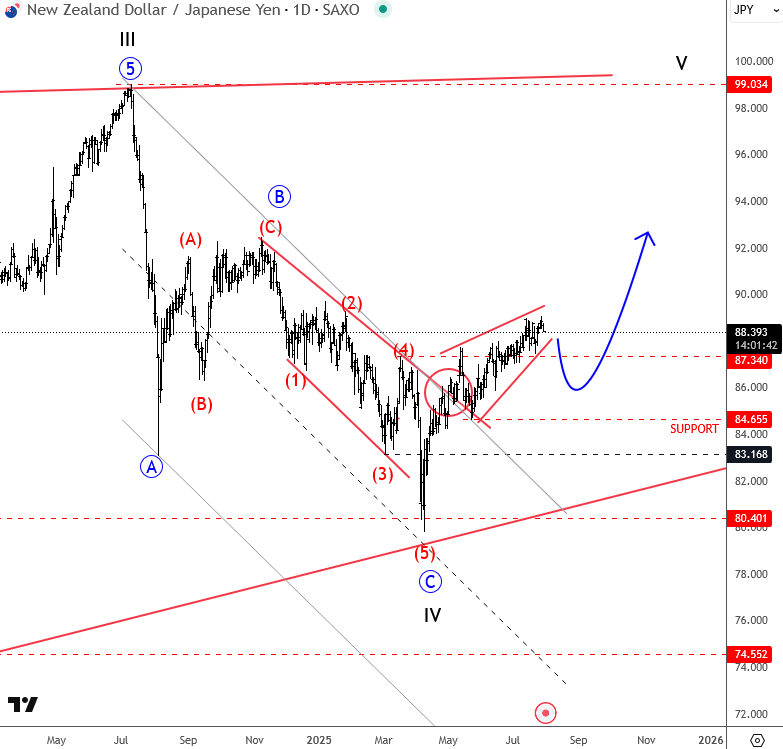
We talked about NZDJPY already back on July 30, where we mentioned and highlighted a bullish turn with a leading diagonal formation into wave A, suggesting more upside after a pullback in wave B. CLICK HERE
www.wavetraders.com
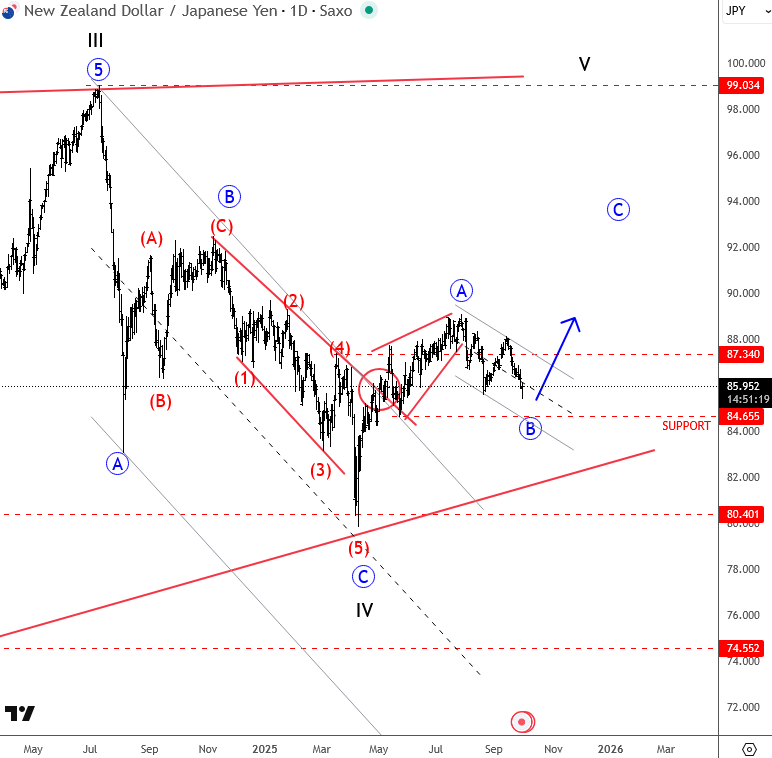
Later on September 30, we updated the chart, when we spotted a corrective pullback in wave B, indicating it was forming a bullish setup formation with waves A and B that can send the price higher for wave C. CLICK HERE
www.wavetraders.com
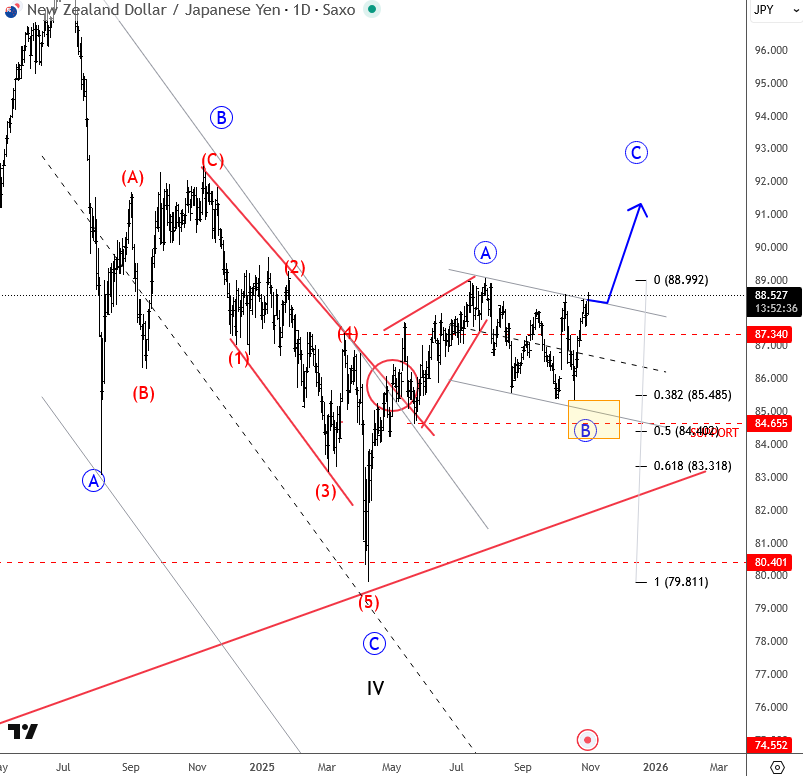
As you can see today on October 30, NZDJPY can be on the way higher within a projected wave C and there’s plenty of room for further recovery, just watch out on short-term pullbacks.
www.wavetraders.com
For more analysis like this, you can watch below our latest recording of a live webinar streamed on October 27:
This article contains syndicated content. We have not reviewed, approved, or endorsed the content, and may receive compensation for placement of the content on this site. For more information please view the Barchart Disclosure Policy here.


/AI%20(artificial%20intelligence)/AI%20engineer%20working%20on%20laptop%20by%20ART%20STOCK%20CREATIVE%20via%20Shutterstock.jpg)

/Semiconductor%20by%20Gorodenkoff%20via%20Shutterstock.jpg)
