Jon Wiedeman 8/12/2025
If you would like to receive more information on the commodity markets or would like to open an account, please click the link Sign Up Now
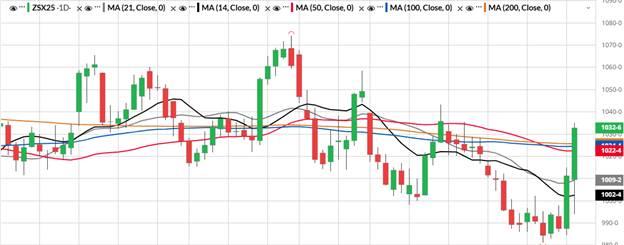
Daily ZSX5:
November bean closed sharpy higher after the USDA report today, taking out majority of the moving averages both on the daily and weekly charts to the upside. The USDA came out with a 53.6 yield compared to their July number of 52.5. Looking at the daily moving averages for November beans we have support at 50 day (1022 ½) 100 day (1024 ½) and lastly (1025 ½) for the 200 day. We were using all of those as resistance previously. Going back the July 3, we have a gap at 1044 ¼ which in my opinion is the next stop for November beans. (see chart below)
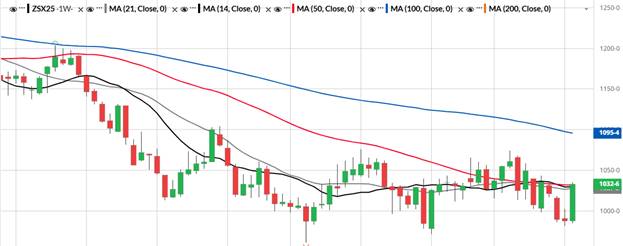
Weekly ZSX5:
Looking at November beans on the weekly charts we have support at 981 ¼ which is last week’s low. Below that we have 971 ¼ which is the April 9th low. The weekly moving averages are coming at (1027 ½) for the 21 day and (1029 ¼) for the 14 day. We have the 50 day moving average at (1031 ½) and lastly the 100 day (1095 ½). (see chart below)
Fundamentals:
Soybeans closed sharply higher on the day after the USDA came out with a 53.6 yield compared to 52.5 from the July report. What the big surprise in beans is planted acres which came in at 80.9 compared to the USDA number in July at 83.4 million acres! With their harvested projected acres of 80.1 was also a surprise compared to their last number of 82.5 million acres. Now that these numbers are in place will turn to the crop tours that begin in the next few weeks and of course weather.
Trade Ideas:
Looking to buy the 1050-1100 call spread in November beans for 10 cents. Would need a break to around the 1020 area in the futures to pick those up.
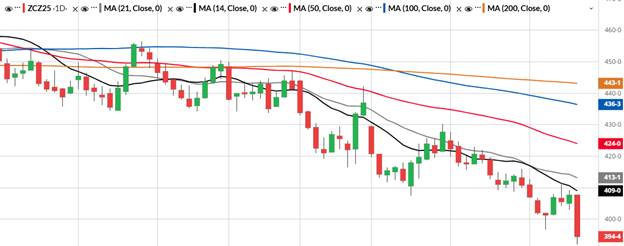
Daily ZCZ5:
December corn closed down sharply after the USDA came in with a whopping yield of 188.8 compared to their yield estimate of 181 last month and also made a new contract low of $3.92. Looking at the daily charts for December corn which appears to have an uphill battle, we have resistance at (409) which is the 14 day moving average and (413 ¼) which is the 21 day. For what we know now it’s a sell the rally kind of market in my opinion. (see chart below).
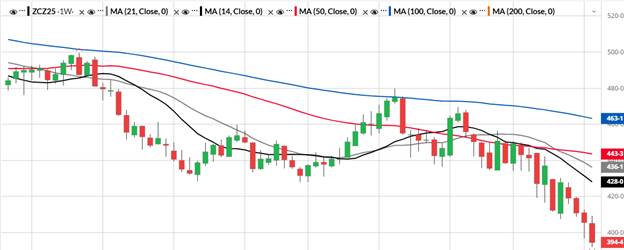
Weekly ZCZ5:
Looking at the damage corn did on the weekly charts in today’s trading session, we have weekly resistance at the $4.00 level and last week high of 412 ¾. Moving average resistance at (427 ¾) which is the 14 day and (436) the 21 day. December corn is now on its 4th week of being lower in a row. (see chart below)
Fundamentals:
The USDA came out with a huge yield of 188.8 which is compared to last months estimate of 181 and 179.3 last year! As far as the acre numbers go today the USDA came in at 97.3 planted acres vs 95.2 last month. Harvested acres estimates were 88.7 compared to 86.6 acres last month. The report was obviously bearish and we will have to look for the crop tours to start in the next few weeks and also next months report which will include field surveys.
Trade Ideas:
N/A
Daily ZWU5:
Wheat followed corn lower on the day after the USDA number and made a new contract low of 503 ¼ and settled at 505 for the September contract. The psychological $5 level is approaching and we will see if there are any sell stops below that level. Looking at the daily moving averages for Sep wheat the 14 day is at (521 ¼) and (528) for the 21 day (see chart below) Last weeks high was 523 ¼ which is also acting as resistance.
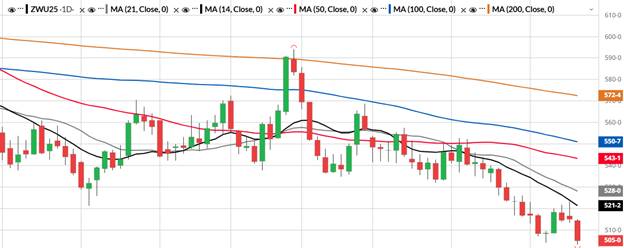
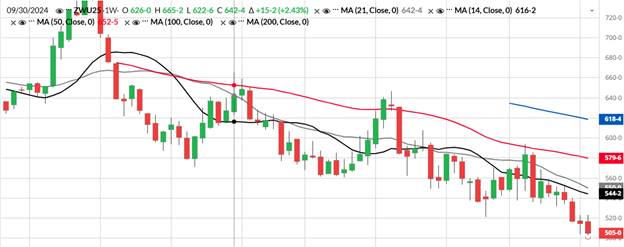
Weekly ZWU5:
With September wheat closing near its contract lows today the weekly charts point towards the $5 level to see if there are any sell stops below in my opinion. Resistance is coming in at 523 ¼ which was last weeks high as well at (544 ¼) which is the 14 day moving average on the weekly charts. (see chart below)
Fundamentals:
The USDA did decrease ending stocks in today’s report, they came in at 869 compared to 890 million bushels. They left the yield relatively unchanged from July with just a slight increase from 52.6 to 56.7. With wheat following corn today we will see if we get below the $5 level and how its acts below there.
Trade Ideas:
Buying the December wheat 530-570 call spread for 9 cents.
If you would like to receive more information on the commodity markets or would like to open an account, please click the link Sign Up Now

Jon Wiedeman
Pure Hedge Division
Direct: 1 312 957 8108
WALSH TRADING INC.
311 S. Wacker Suite 540
Chicago, Illinois 60606
Walsh Trading, Inc. is registered as a Guaranteed Introducing Broker with the Commodity Futures Trading Commission and an NFA Member.
Futures and options trading involves substantial risk and is not suitable for all investors. Therefore, individuals should carefully consider their financial condition in deciding whether to trade. Option traders should be aware that the exercise of a long option will result in a futures position. The valuation of futures and options may fluctuate, and as a result, clients may lose more than their original investment. The information contained on this site is the opinion of the writer or was obtained from sources cited within the commentary. The impact on market prices due to seasonal or market cycles and current news events may already be reflected in market prices. PAST PERFORMANCE IS NOT NECESSARILY INDICATIVE OF FUTURE RESULTS.
All information, communications, publications, and reports, including this specific material, used and distributed by Walsh Trading, Inc. (“WTI”) shall be construed as a solicitation for entering into a derivatives transaction. WTI does not distribute research reports, employ research analysts, or maintain a research department as defined in CFTC Regulation 1.71.


/Netflix%20on%20tv%20with%20remote%20by%20freestocks%20via%20Unsplash.jpg)

/McDonald's%20Corp%20arches%20by-%20TonyBaggett%20via%20iStock.jpg)
/Alphabet%20(Google)%20Image%20by%20Markus%20Mainka%20via%20Shutterstock.jpg)