[[ type === 'moc' ? 'MARKET ON CLOSE' : 'FREE WEBINAR' ]]
[[ timeLabel ]] WATCH LIVE:
Your browser of choice has not been tested for use with Barchart.com. If you have issues, please download one of the browsers listed here.
Stocks | Futures | Watchlist | News | More
or
Faster, Cleaner, Better.

NCDEX Soybean Nov '11 (K1X11)

[[ item.lastPrice ]] [[ item.priceChange ]] ([[ item.percentChange ]]) [[ item.tradeTime ]] [NCDEX]
[[ item.bidPrice ]] x [[ item.bidSize ]] [[ item.askPrice ]] x [[ item.askSize ]]
[[ rootItem.symbol ]]underlying price [[ rootItem.lastPrice ]] [[ rootItem.priceChange ]] ([[ rootItem.percentChange ]]) [[ rootItem.tradeTime ]]
Quote Overview for [[ item.sessionDateDisplayLong ]]
[[ rowChartData.labelLow ]]
[[ rowChartData.lowPriceFormatted ]]
[[ rowChartData.lowPrice ]]
[[ rowChartData.labelHigh ]]
[[ rowChartData.highPriceFormatted ]]
[[ rowChartData.highPrice ]]
since [[ rowChartData.lowDate ]]
since [[ rowChartData.highDate ]]
[[ value ]] [[ value ]] ([[ financialData.relativeStrengthDirection14d ]]) ([[ financialData.highPercent1y ]]) ([[ financialData.lowPercent1y ]])

Contract Specifications

See More
Contract
N/A
Contract Size
N/A
Tick Size
N/A
Trading Hours
N/A
Exchange
NCDEX
Point Value
N/A

Seasonal Chart

NCDEX Soybean Nov '11
Average Price Chart for 5 Prior Nov Contracts
Get Realtime - Quotes and Charts for Futures Traders. Learn More >>

Price Performance

See More
Period Period Low Period High Performance
1-Month
2,134.00 +3.23%
on 10/20/11
2,271.00 -2.99%
on 10/25/11
+63.50 (+2.97%)
since 10/18/11
3-Month
2,060.00 +6.94%
on 10/10/11
2,342.50 -5.96%
on 08/30/11
-15.00 (-0.68%)
since 08/18/11

More NCDEX Soybean Quotes

All Futures Prices
Please wait...

Most Recent Stories

More News
GDP, Earnings and Other Key Things to Watch this Week

Markets enter the final week of May with a holiday-shortened trading schedule following Memorial Day Monday closure, compressing important economic data and high-profile earnings into four sessions.

COST : 1,028.24 (-2.11%)
SNOW : 172.20 (+4.02%)
DELL : 295.19 (+16.77%)
CRM : 180.07 (+2.13%)
MRVL : 196.33 (+2.96%)
Mark Cuban Says Republicans, Independents, Democrats All ‘Want Cheaper Drugs' — So Now He's Teaming Up With TrumpRx to Make It Happen

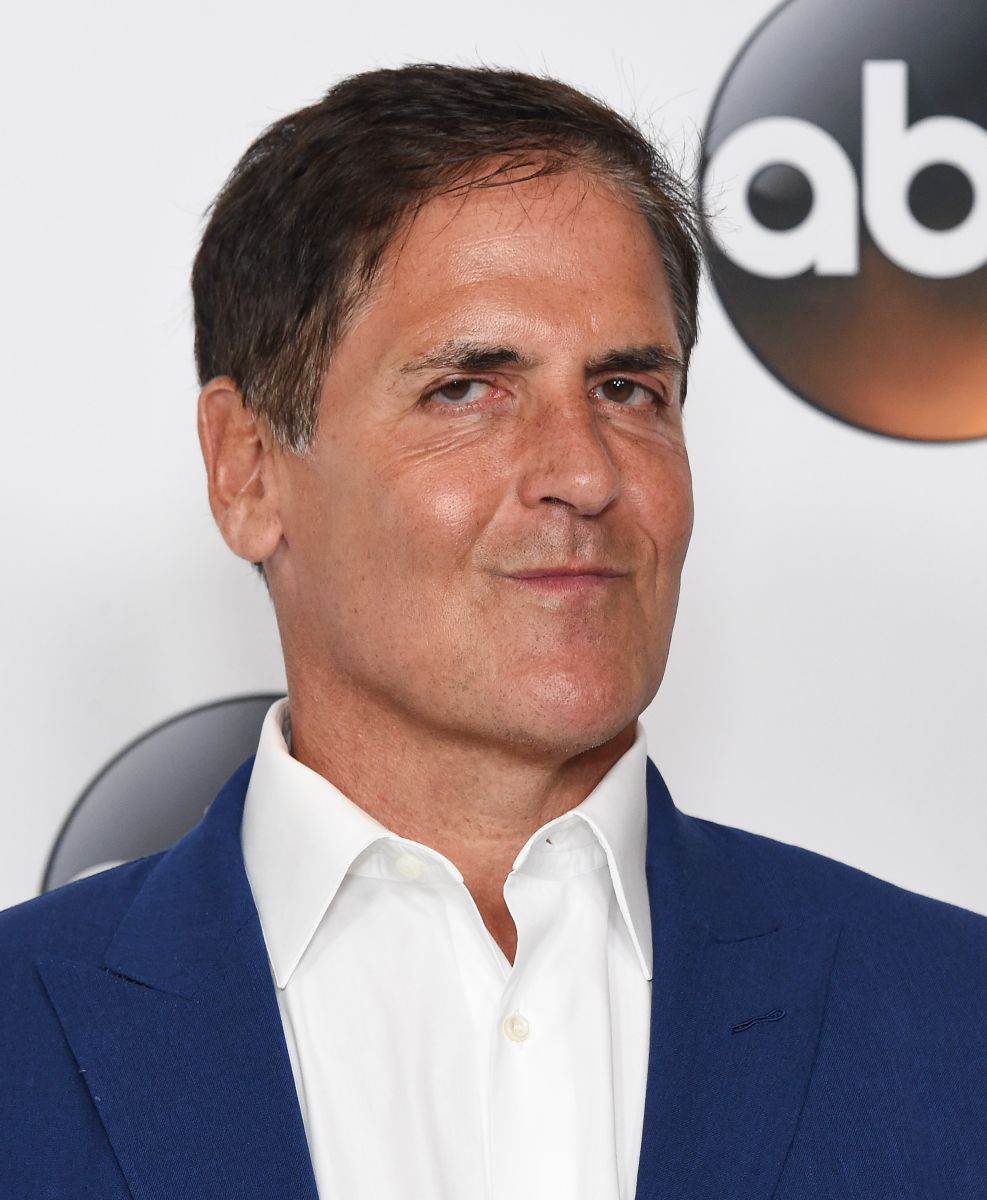
Mark Cuban partnered with TrumpRx to lower drug prices, adding 559 generics from his Cost Plus Drug Company to the portal, focusing on price transparency.

Rising Rates Are Threatening to Kill the Zombies and Send Small-Cap Stocks Plunging

A consequential threat to the market is quietly developing in fixed income.

EFA : 103.98 (-0.20%)
ZNU26 : 108-315s (+0.01%)
IWM : 285.12 (+0.93%)
RSP : 206.58 (+0.91%)
Should You Outsource Your Financial Advice to ChatGPT?

People are warming to AI-powered chat as a sounding board for their money matters. What they'll actually get from the experience is mixed.

Stocks Settle Higher on Iran Peace Hopes and Tech Strength

The S&P 500 Index ($SPX ) (SPY ) on Friday closed up +0.37%, the Dow Jones Industrial Average ($DOWI ) (DIA ) closed up +0.58%, and the Nasdaq 100 Index ($IUXX ) (QQQ ) closed up +0.42%. June E-mini S&P...

AMAT : 432.16 (+1.12%)
INTU : 319.94 (+4.19%)
ADI : 397.07 (+3.35%)
DDOG : 222.32 (+1.96%)
MRK : 122.41 (+5.64%)
TXN : 309.21 (+3.63%)
$IUXX : 29,481.64 (+0.42%)
COIN : 184.99 (-4.43%)
ASML : 1,632.90 (+2.57%)
ZNM26 : 109-080s (+0.01%)
ESM26 : 7,491.00s (+0.33%)
QCOM : 238.16 (+11.60%)
Stocks Climb on US-Iran Peace Hopes and Strength in Chipmakers

The S&P 500 Index ($SPX ) (SPY ) today is up +0.50%, the Dow Jones Industrial Average ($DOWI ) (DIA ) is up +0.63%, and the Nasdaq 100 Index ($IUXX ) (QQQ ) is up +0.73%. June E-mini S&P futures (ESM26...

AMAT : 432.16 (+1.12%)
INTU : 319.94 (+4.19%)
ADI : 397.07 (+3.35%)
DDOG : 222.32 (+1.96%)
MRK : 122.41 (+5.64%)
TXN : 309.21 (+3.63%)
$IUXX : 29,481.64 (+0.42%)
ASML : 1,632.90 (+2.57%)
ZNM26 : 109-080s (+0.01%)
ESM26 : 7,491.00s (+0.33%)
QCOM : 238.16 (+11.60%)
IBM : 253.84 (+0.34%)
Stocks Supported by US-Iran Peace Deal Optimism

The S&P 500 Index ($SPX ) (SPY ) today is up +0.54%, the Dow Jones Industrial Average ($DOWI ) (DIA ) is up +0.70%, and the Nasdaq 100 Index ($IUXX ) (QQQ ) is up +0.53%. June E-mini S&P futures (ESM26...

AMAT : 432.16 (+1.12%)
INTU : 319.94 (+4.19%)
ADI : 397.07 (+3.35%)
DDOG : 222.32 (+1.96%)
MRK : 122.41 (+5.64%)
TXN : 309.21 (+3.63%)
$IUXX : 29,481.64 (+0.42%)
ASML : 1,632.90 (+2.57%)
ZNM26 : 109-080s (+0.01%)
MSFT : 418.57 (-0.12%)
ESM26 : 7,491.00s (+0.33%)
QCOM : 238.16 (+11.60%)
S&P Futures Gain as Bond Yields Fall, U.S.-Iran Updates Awaited

June S&P 500 E-Mini futures (ESM26) are trending up +0.15% this morning as Treasury yields fell, putting the benchmark index on course for its eighth consecutive weekly gain.

SNDK : 1,478.69 (-4.12%)
INTU : 319.94 (+4.19%)
EL : 88.32 (+11.92%)
TXN : 309.21 (+3.63%)
RGTI : 26.42 (+19.87%)
WDAY : 128.14 (+5.16%)
ESM26 : 7,491.00s (+0.33%)
ZM : 105.64 (+9.19%)
QBTS : 29.40 (+14.22%)
PUIG.E.DX : 15.290 (-13.22%)
ROST : 234.81 (+8.11%)
RL : 377.78 (+0.77%)
Stocks Rebound as Crude Oil Falls on Hopes for a US-Iran Deal

The S&P 500 Index ($SPX ) (SPY ) on Thursday closed up +0.17%, the Dow Jones Industrial Average ($DOWI ) (DIA ) closed up +0.55%, and the Nasdaq 100 Index ($IUXX ) (QQQ ) closed up +0.20%. June E-mini...

ALK : 41.34 (+0.61%)
UAL : 99.96 (+0.32%)
DE : 529.15 (-0.41%)
SNDK : 1,478.69 (-4.12%)
INTU : 319.94 (+4.19%)
ADI : 397.07 (+3.35%)
TXN : 309.21 (+3.63%)
ENS : 232.24 (-2.79%)
RGTI : 26.42 (+19.87%)
$IUXX : 29,481.64 (+0.42%)
ZNM26 : 109-080s (+0.01%)
ESM26 : 7,491.00s (+0.33%)
Stocks Indexes Turn Green in Afternoon Trade as Oil Prices Retreat

The S&P 500 Index ($SPX ) (SPY ) is up +0.15%, the Dow Jones Industrial Average ($DOWI ) (DIA ) is up +0.34%, and the Nasdaq 100 Index ($IUXX ) (QQQ ) is up +0.14%. Equity markets are pushing higher...

DE : 529.15 (-0.41%)
INTU : 319.94 (+4.19%)
SNDK : 1,478.69 (-4.12%)
ADI : 397.07 (+3.35%)
TXN : 309.21 (+3.63%)
ENS : 232.24 (-2.79%)
RGTI : 26.42 (+19.87%)
$IUXX : 29,481.64 (+0.42%)
ZNM26 : 109-080s (+0.01%)
MSFT : 418.57 (-0.12%)
QCOM : 238.16 (+11.60%)
IBM : 253.84 (+0.34%)

Key Turning Points

3rd Resistance Point N/A
2nd Resistance Point 2,222.00
1st Resistance Point 2,212.50
Last Price 2,203.00s
1st Support Level 2,195.00
2nd Support Level 2,187.00
3rd Support Level N/A

See More

52-Week High 2,394.50
Fibonacci 61.8% 2,266.72
Fibonacci 50% 2,227.25
Last Price 2,203.00s
Fibonacci 38.2% 2,187.78
52-Week Low 2,060.00

See More

Want to use this as
your default charts setting?
Save this setup as a Chart Templates
Switch the Market flag
for targeted data from your country of choice.
Open the menu and switch the
Market flag for targeted data from your country of choice.
Want Streaming Chart Updates?
Switch your Site Preferences
to use Interactive Charts
Need More Chart Options?
Right-click on the chart to open the Interactive Chart menu.
Use your up/down arrows to move through the symbols.