Your browser of choice has not been tested for use with Barchart.com. If you have issues, please download one of the browsers listed here.
Less than $10/month! View ALL results for your Stocks, ETFs and Funds Screeners with Barchart Plus. FREE 30 Day Trial
Stocks | Futures | Watchlist | More
or

Palladium Sep '19 (PAU19)

[[ item.lastPrice ]] [[ item.priceChange ]] ([[ item.percentChange ]]) [[ item.tradeTime ]] [NYMEX]
[[ item.bidPrice ]] x [[ item.bidSize ]] [[ item.askPrice ]] x [[ item.askSize ]]
[[ rootItem.symbol ]]underlying price [[ rootItem.lastPrice ]] [[ rootItem.priceChange ]] ([[ rootItem.percentChange ]]) [[ rootItem.tradeTime ]]
Quote Overview for [[ item.sessionDateDisplayLong ]]
[[ rowChartData.labelLow ]]
[[ rowChartData.lowPriceFormatted ]]
[[ rowChartData.lowPrice ]]
[[ rowChartData.labelHigh ]]
[[ rowChartData.highPriceFormatted ]]
[[ rowChartData.highPrice ]]
since [[ rowChartData.lowDate ]]
since [[ rowChartData.highDate ]]
[[ value ]] [[ value ]]

Contract Specifications

See More
Contract
Palladium
Contract Size
100 troy ounces
Tick Size
0.50 (50 cents) per troy ounce ($50.00 per contract)
Trading Hours
5:00p.m. - 4:00p.m. (Sun-Fri) (RTH 7:30a.m. - 12:00p.m.) (Settles 12:00p.m.) CST
Exchange
NYMEX
Point Value
$100
Margin/Maintenance
$13,750/12,500
First Notice Date
08/30/19
Expiration Date
09/26/19 (expired)

Seasonal Chart

Palladium Sep '19
Average Price Chart for 5 Prior Sep Contracts

Commitment of Traders Positions as of Apr 16, 2024

View Chart Details
Commercials - Long / Short
11,759 (+273)
2,735 (+238)
Non-Commercials - Long / Short
5,414 (-342)
14,448 (-74)
Producers - Long / Short
2,719 (+26)
1,664 (+87)
Swap Dealers - Long / Short
9,023 (+245)
1,054 (+149)
Managed Money - Long / Short
3,672 (-582)
13,206 (-642)
Other Reportables - Long / Short
1,742 (+240)
1,242 (+568)
Get Realtime - Quotes and Charts for Futures Traders. Learn More >>

Price Performance

See More
Period Period Low Period High Performance
1-Month
1,451.90 +13.28%
on 08/28/19
1,693.00 -2.85%
on 09/24/19
+172.40 (+11.71%)
since 08/26/19
3-Month
1,378.20 +19.34%
on 08/02/19
1,693.00 -2.85%
on 09/24/19
+119.00 (+7.80%)
since 06/26/19
52-Week
1,023.50 +60.69%
on 10/04/18
1,693.00 -2.85%
on 09/24/19
+603.80 (+58.01%)
since 09/26/18

More Palladium Quotes

All Futures Prices
Please wait...

Most Recent Stories

More News
Dollar Little Changed on Lower Bond Yields and Stock Weakness

The dollar index (DXY00 ) on Friday rose by +0.01%. The dollar on Friday gave up most of an overnight advance and finished little changed. The dollar spiked higher in overnight trade after US officials...

DXY00 : 106.137 (-0.01%)
^EURUSD : 1.06537 (+0.10%)
^USDJPY : 154.626 (-0.01%)
GCM24 : 2,402.5 (+0.19%)
SIK24 : 28.695 (+1.11%)
1 Steel Stock Under $10 With 57% Upside Potential

Gerdau is an undervalued stock you can buy right now, as it trades at a compelling valuation and a significant discount to analyst estimates.
HVK24 : 810.00 (-1.10%)
GGB : 3.66 (+2.52%)
$SPX : 4,967.23 (-0.88%)
JPM : 185.80 (+2.51%)
GS : 404.00 (+0.22%)
Why is Gold Ignoring Higher Rates and a Stronger Dollar?

Gold is the world’s oldest currency. Historically, rising interest rates and a strong U.S. dollar have been bearish for gold prices. Meanwhile, the traditional trading patterns have not impacted gold...

ZBM24 : 114-19 (+0.41%)
$DXY : 106.14 (-0.03%)
GCM24 : 2,402.5 (+0.19%)
What's the Better Safe Haven Market? (Part 2)

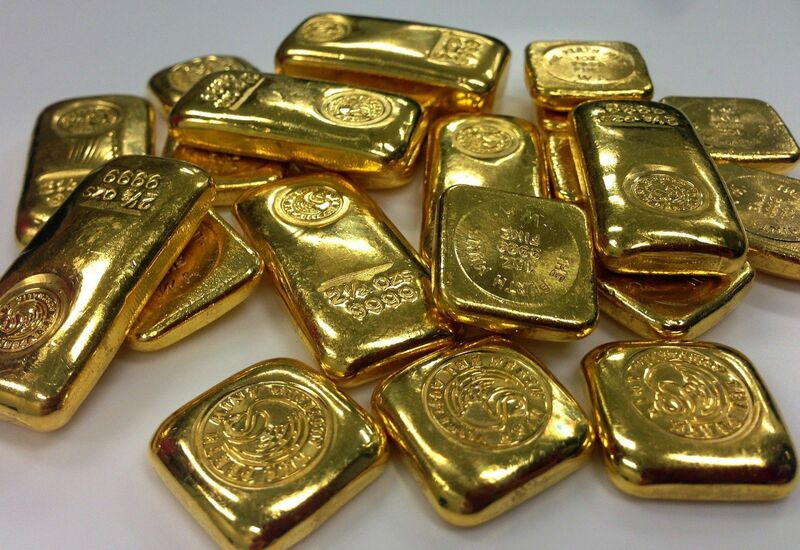
As a follow-up to a piece I posted 6 months ago, I again discuss the role of gold as a safe have market.
GCY00 : 2,387.62 (+0.40%)
GCM24 : 2,402.5 (+0.19%)
GLD : 221.05 (+0.32%)
Stocks Fall Back on Middle East Tensions and Chip Stock Weakness

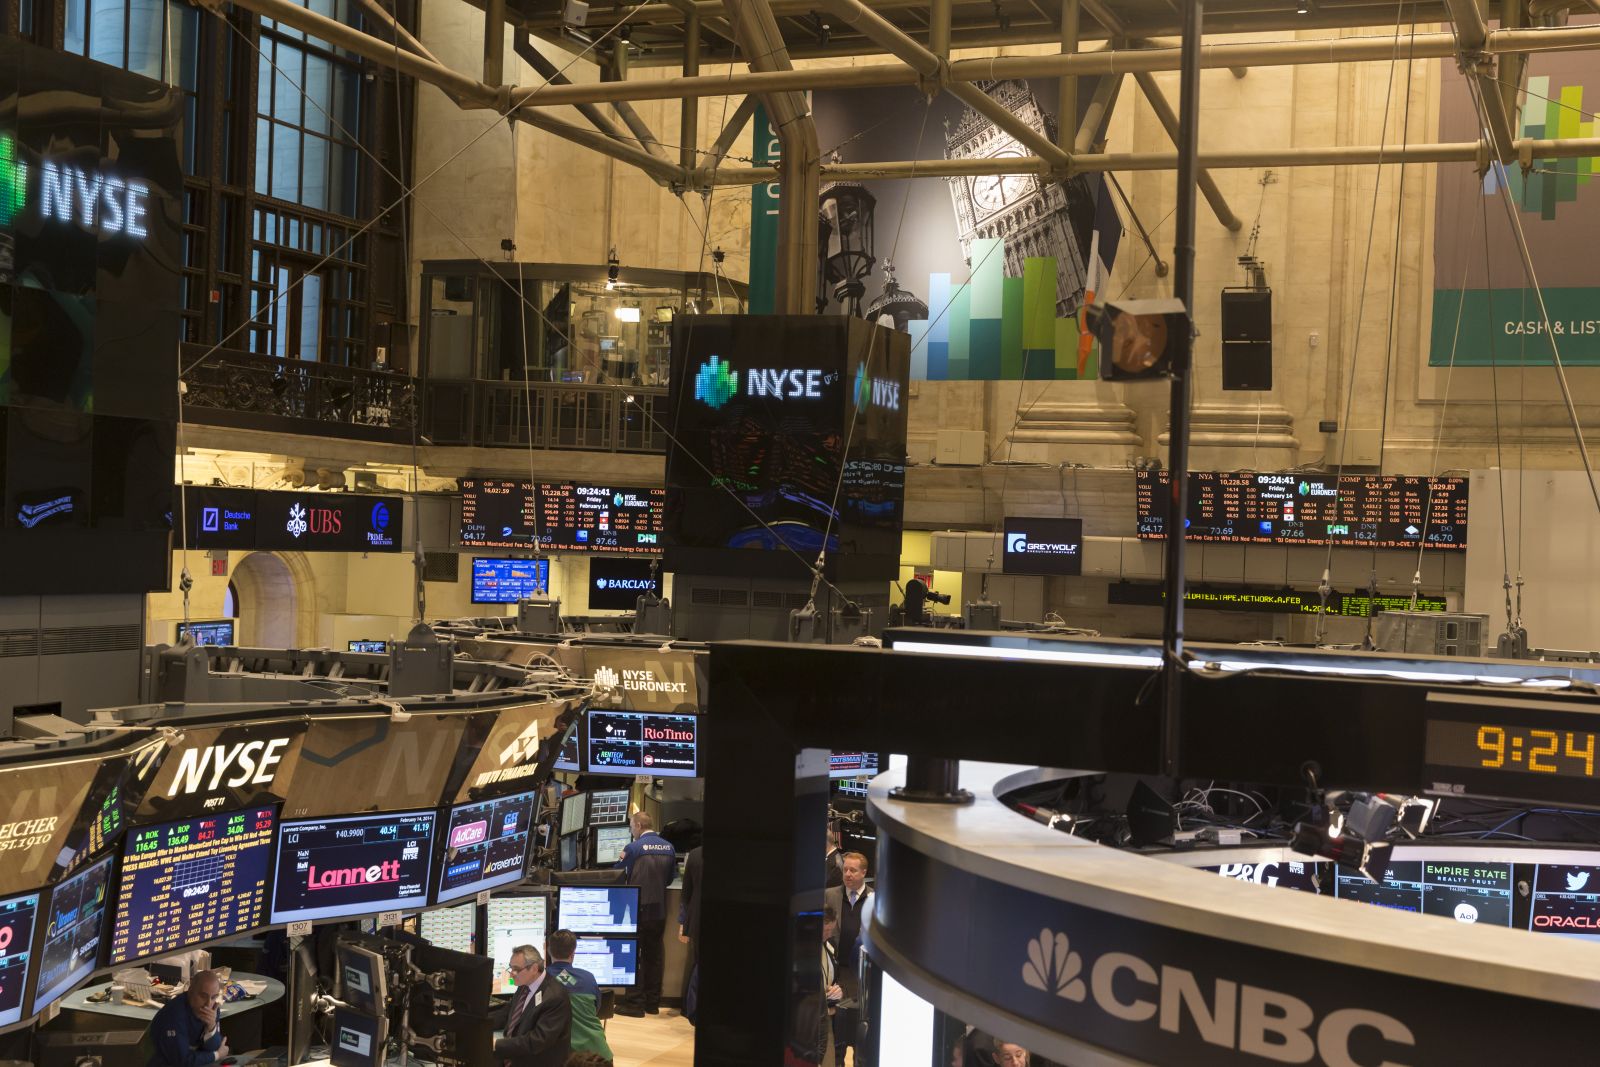
The S&P 500 Index ($SPX ) (SPY ) this morning is down -0.25%, the Dow Jones Industrials Index ($DOWI ) (DIA ) is up +0.41%, and the Nasdaq 100 Index ($IUXX ) (QQQ ) is down -0.92%. US stock indexes this...

$SPX : 4,967.23 (-0.88%)
SPY : 495.16 (-0.87%)
$DOWI : 37,986.40 (+0.56%)
DIA : 379.77 (+0.56%)
$IUXX : 17,037.65 (-2.05%)
QQQ : 414.65 (-2.07%)
ZNM24 : 107-270 (+0.13%)
SMCI : 713.65 (-23.14%)
NFLX : 555.04 (-9.09%)
JBL : 118.75 (-8.36%)
NVDA : 762.00 (-10.00%)
AMD : 146.64 (-5.44%)
'Hot Prospects' Screener Points to Sustained Upside for Agnico-Eagle Mines (AEM)

A combination of strong fundamentals and Barchart’s proprietary analytics puts the spotlight on AEM stock.

AEM : 63.84 (+0.58%)
Up 34% YTD, Is This Copper Stock Overvalued?

Southern Copper is a mining giant that has surged more than 30% in 2024, leaving the broader market's returns in the rearview. Is SCCO stock still a good buy right now?

SCCO : 113.43 (-1.66%)
HGK24 : 4.4905 (+1.22%)
SIK24 : 28.695 (+1.11%)
C : 59.14 (+1.41%)
BAC : 36.97 (+3.35%)
Dollar Climbs as T-Note Yields Rise and Stocks Fall

The dollar index (DXY00 ) Thursday rose by +0.16%. The dollar recovered from early losses and moved higher Thursday after T-note yields climbed on signs of strength in the US economy when weekly jobless...

DXY00 : 106.137 (-0.01%)
^EURUSD : 1.06537 (+0.10%)
^USDJPY : 154.626 (-0.01%)
GCM24 : 2,402.5 (+0.19%)
SIK24 : 28.695 (+1.11%)
Why You Should Be a HODLer of Gold

U.S. retail investors have largely ignored gold and sold gold ETFs, even as demand from central banks is setting records. Gold looks set to move up to all-time highs above $3,000, so there's still time...

GCM24 : 2,402.5 (+0.19%)
C : 59.14 (+1.41%)
HMY : 9.29 (+1.86%)
Strong Manufacturing Data Sends Yields Higher! Can Stocks Rally?

Philly Fed Manufacturing expands to the highest level seen in two years. Initial and continuing jobless claims continue to show strength, putting pressure on bond prices. Earnings season will kick off...

Key Turning Points

3rd Resistance Point N/A
2nd Resistance Point 1,644.70
1st Resistance Point 1,644.70
Last Price 1,644.70s
1st Support Level 1,644.70
2nd Support Level 1,644.70
3rd Support Level N/A

See More

52-Week High 1,693.00
Last Price 1,644.70s
Fibonacci 61.8% 1,437.25
Fibonacci 50% 1,358.25
Fibonacci 38.2% 1,279.25
52-Week Low 1,023.50

See More

Want to use this as
your default charts setting?
Save this setup as a Chart Templates
Switch the Market flag
for targeted data from your country of choice.
Open the menu and switch the
Market flag for targeted data from your country of choice.
Want Streaming Chart Updates?
Switch your Site Preferences
to use Interactive Charts
Need More Chart Options?
Right-click on the chart to open the Interactive Chart menu.

Free Barchart Webinar