Your browser of choice has not been tested for use with Barchart.com. If you have issues, please download one of the browsers listed here.
UNLIMITED Watchlists, Portfolios, Screeners, and other Barchart tools with Barchart Premier. FREE 30 Day Trial
Stocks | Futures | Watchlist | More
or

Eurex 3Month EuriBor Sep '16 (TVU16)

[[ item.lastPrice ]] [[ item.priceChange ]] ([[ item.percentChange ]]) [[ item.tradeTime ]] [EUREX]
[[ item.bidPrice ]] x [[ item.bidSize ]] [[ item.askPrice ]] x [[ item.askSize ]]
[[ rootItem.symbol ]]underlying price [[ rootItem.lastPrice ]] [[ rootItem.priceChange ]] ([[ rootItem.percentChange ]]) [[ rootItem.tradeTime ]]
Quote Overview for [[ item.sessionDateDisplayLong ]]
[[ rowChartData.labelLow ]]
[[ rowChartData.lowPriceFormatted ]]
[[ rowChartData.lowPrice ]]
[[ rowChartData.labelHigh ]]
[[ rowChartData.highPriceFormatted ]]
[[ rowChartData.highPrice ]]
since [[ rowChartData.lowDate ]]
since [[ rowChartData.highDate ]]
[[ value ]] [[ value ]]

Contract Specifications

See More
Contract
3-Month EuriBor
Contract Size
EUR 1,000,000
Tick Size
0.005 percent (EUR 12.50 per contract)
Trading Hours
8:00a.m. - 7:00p.m. (CET)
Exchange
EUREX
Point Value
EUR 2,500
Expiration Date
09/19/16 (expired)

Seasonal Chart

Eurex 3Month EuriBor Sep '16
Average Price Chart for 5 Prior Sep Contracts
Get Realtime - Quotes and Charts for Futures Traders. Learn More >>

Price Performance

See More
Period Period Low Period High Performance
1-Month
100.301 unch
on 09/19/16
100.315 -0.01%
on 09/07/16
-0.009 (-0.01%)
since 08/19/16
3-Month
100.270 +0.03%
on 06/20/16
100.340 -0.04%
on 07/07/16
+0.031 (+0.03%)
since 06/17/16
52-Week
100.035 +0.27%
on 09/21/15
100.365 -0.06%
on 02/03/16
+0.266 (+0.27%)
since 09/18/15

More Eurex 3Month EuriBor Quotes

All Futures Prices
Please wait...

Most Recent Stories

More News
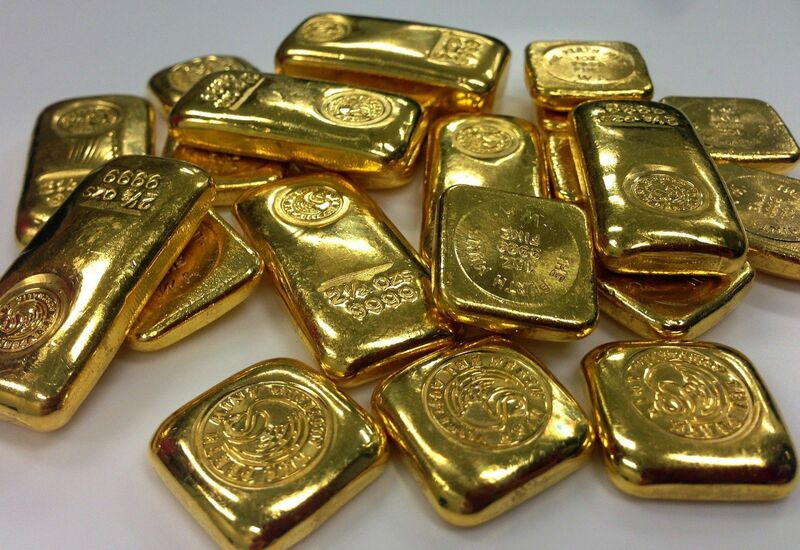
Why is Gold Ignoring Higher Rates and a Stronger Dollar?

Gold is the world’s oldest currency. Historically, rising interest rates and a strong U.S. dollar have been bearish for gold prices. Meanwhile, the traditional trading patterns have not impacted gold...
ZBM24 : 114-15 (+0.30%)
$DXY : 106.10 (-0.07%)
GCM24 : 2,413.3 (+0.64%)
Stocks Fall Back on Middle East Tensions and Chip Stock Weakness

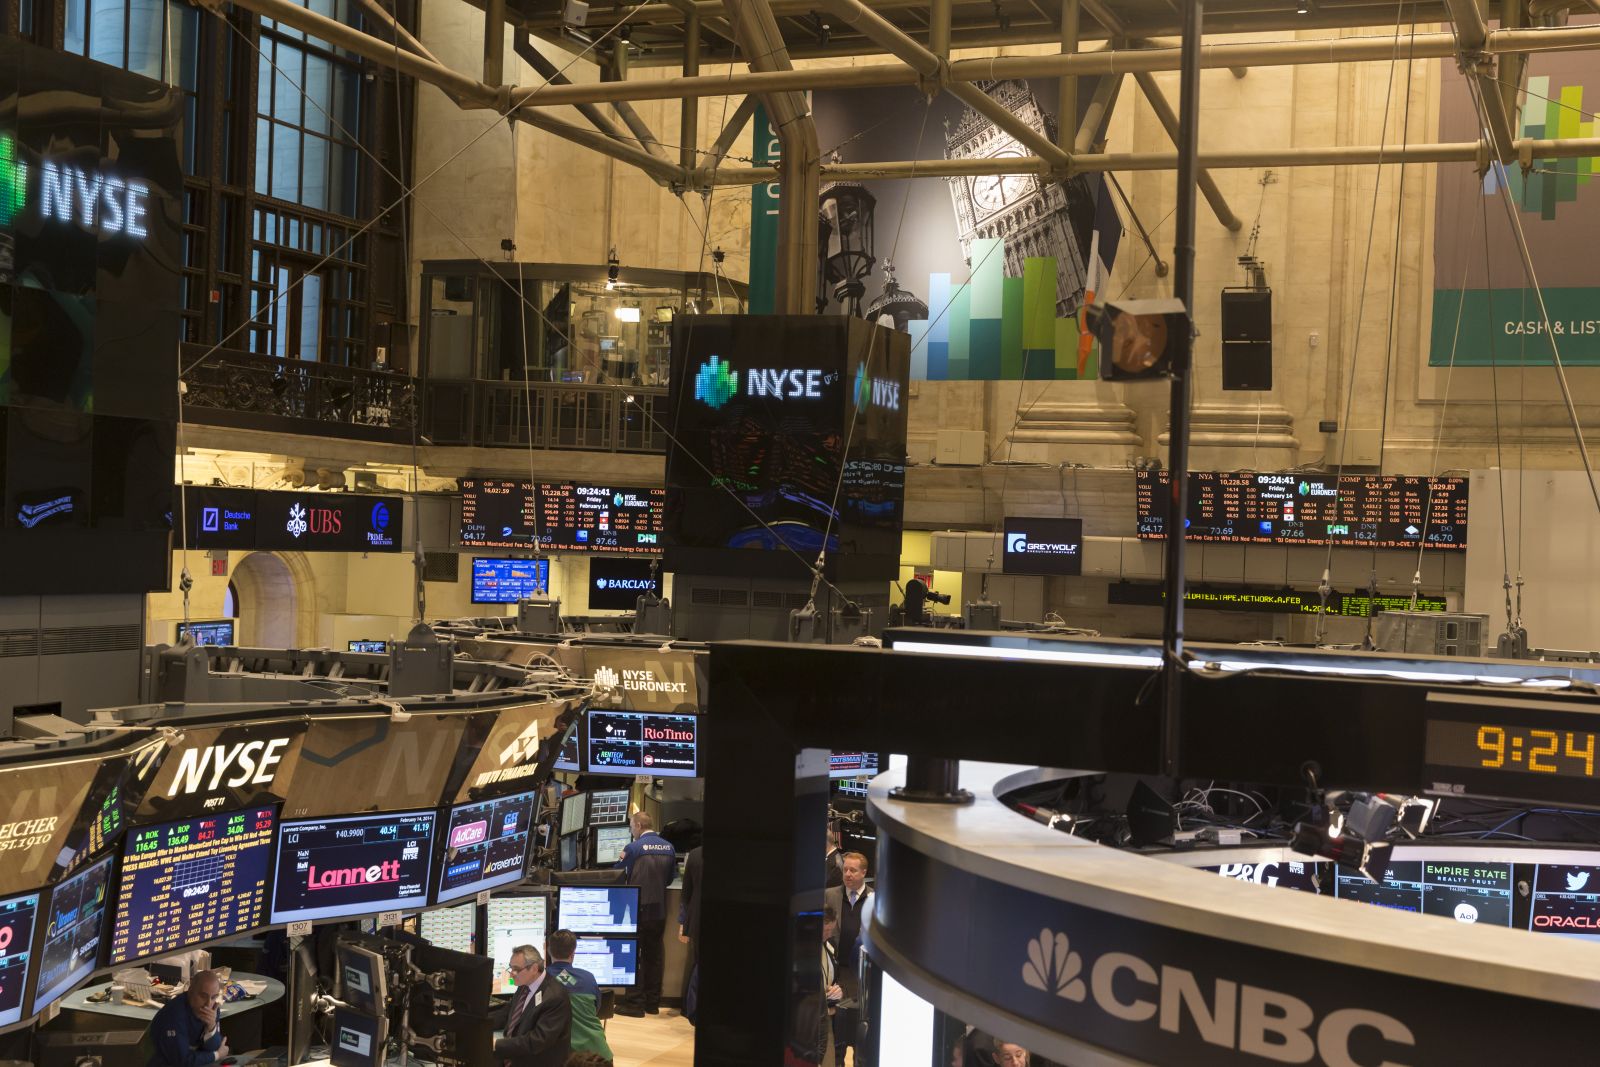
The S&P 500 Index ($SPX ) (SPY ) this morning is down -0.25%, the Dow Jones Industrials Index ($DOWI ) (DIA ) is up +0.41%, and the Nasdaq 100 Index ($IUXX ) (QQQ ) is down -0.92%. US stock indexes this...

$SPX : 4,985.38 (-0.51%)
SPY : 497.13 (-0.48%)
$DOWI : 38,029.16 (+0.67%)
DIA : 380.03 (+0.58%)
$IUXX : 17,140.32 (-1.46%)
QQQ : 417.25 (-1.45%)
ZNM24 : 107-270 (+0.13%)
SMCI : 756.82 (-18.49%)
NFLX : 556.91 (-8.79%)
JBL : 120.90 (-6.71%)
NVDA : 806.39 (-4.76%)
AMD : 149.42 (-3.65%)
Stocks Pressured by Middle East Tensions

The S&P 500 Index ($SPX ) (SPY ) this morning is down -0.09%, the Dow Jones Industrials Index ($DOWI ) (DIA ) is up +0.29%, and the Nasdaq 100 Index ($IUXX ) (QQQ ) is down -0.60%. US stock indexes this...

$SPX : 4,985.38 (-0.51%)
SPY : 497.13 (-0.48%)
$DOWI : 38,029.16 (+0.67%)
DIA : 380.03 (+0.58%)
$IUXX : 17,140.32 (-1.46%)
QQQ : 417.25 (-1.45%)
ZNM24 : 107-270 (+0.13%)
NFLX : 556.91 (-8.79%)
JBL : 120.90 (-6.71%)
ULTA : 414.83 (-2.42%)
PSTG : 48.98 (-5.48%)
PG : 157.03 (-0.17%)
P&G: Fiscal Q3 Earnings Snapshot

P&G: Fiscal Q3 Earnings Snapshot

PG : 157.03 (-0.17%)
Stocks Finish Lower on Hawkish Fed and Rising Bond Yields

The S&P 500 Index ($SPX ) (SPY ) Thursday closed down -0.22%, the Dow Jones Industrials Index ($DOWI ) (DIA ) closed up +0.06%, and the Nasdaq 100 Index ($IUXX ) (QQQ ) closed down -0.57%. US stock indexes...
$SPX : 4,985.38 (-0.51%)
SPY : 497.13 (-0.48%)
$DOWI : 38,029.16 (+0.67%)
DIA : 380.03 (+0.58%)
$IUXX : 17,140.32 (-1.46%)
QQQ : 417.25 (-1.45%)
ZNM24 : 107-270 (+0.13%)
APTV : 69.52 (+0.29%)
EFX : 215.90 (-0.74%)
SNA : 268.25 (+2.48%)
URBN : 36.81 (-0.57%)
MU : 107.42 (-4.03%)
TSMC: Q1 Earnings Snapshot

TSMC: Q1 Earnings Snapshot

TSM : 128.12 (-3.14%)
Stocks Give Up Early Gains and are Now in the Red

The S&P 500 Index ($SPX ) (SPY ) is down -0.24%, the Dow Jones Industrials Index ($DOWI ) (DIA ) is down -0.05%, and the Nasdaq 100 Index ($IUXX ) (QQQ ) is down -0.42%. US stock indexes are moderately...

$SPX : 4,985.38 (-0.51%)
SPY : 497.13 (-0.48%)
$DOWI : 38,029.16 (+0.67%)
DIA : 380.03 (+0.58%)
$IUXX : 17,140.32 (-1.46%)
QQQ : 417.25 (-1.45%)
ZNM24 : 107-270 (+0.13%)
UNH : 505.67 (+2.53%)
ELV : 534.42 (+1.76%)
CNC : 75.10 (+1.83%)
WEC : 81.78 (+1.67%)
LEN : 150.71 (-1.17%)
The ES can't hold a bid, this correction isn't over

In the big picture, stocks are expensive and bonds are cheap
Stocks Pressured by Higher Bond Yields and Chip Stock Weakness

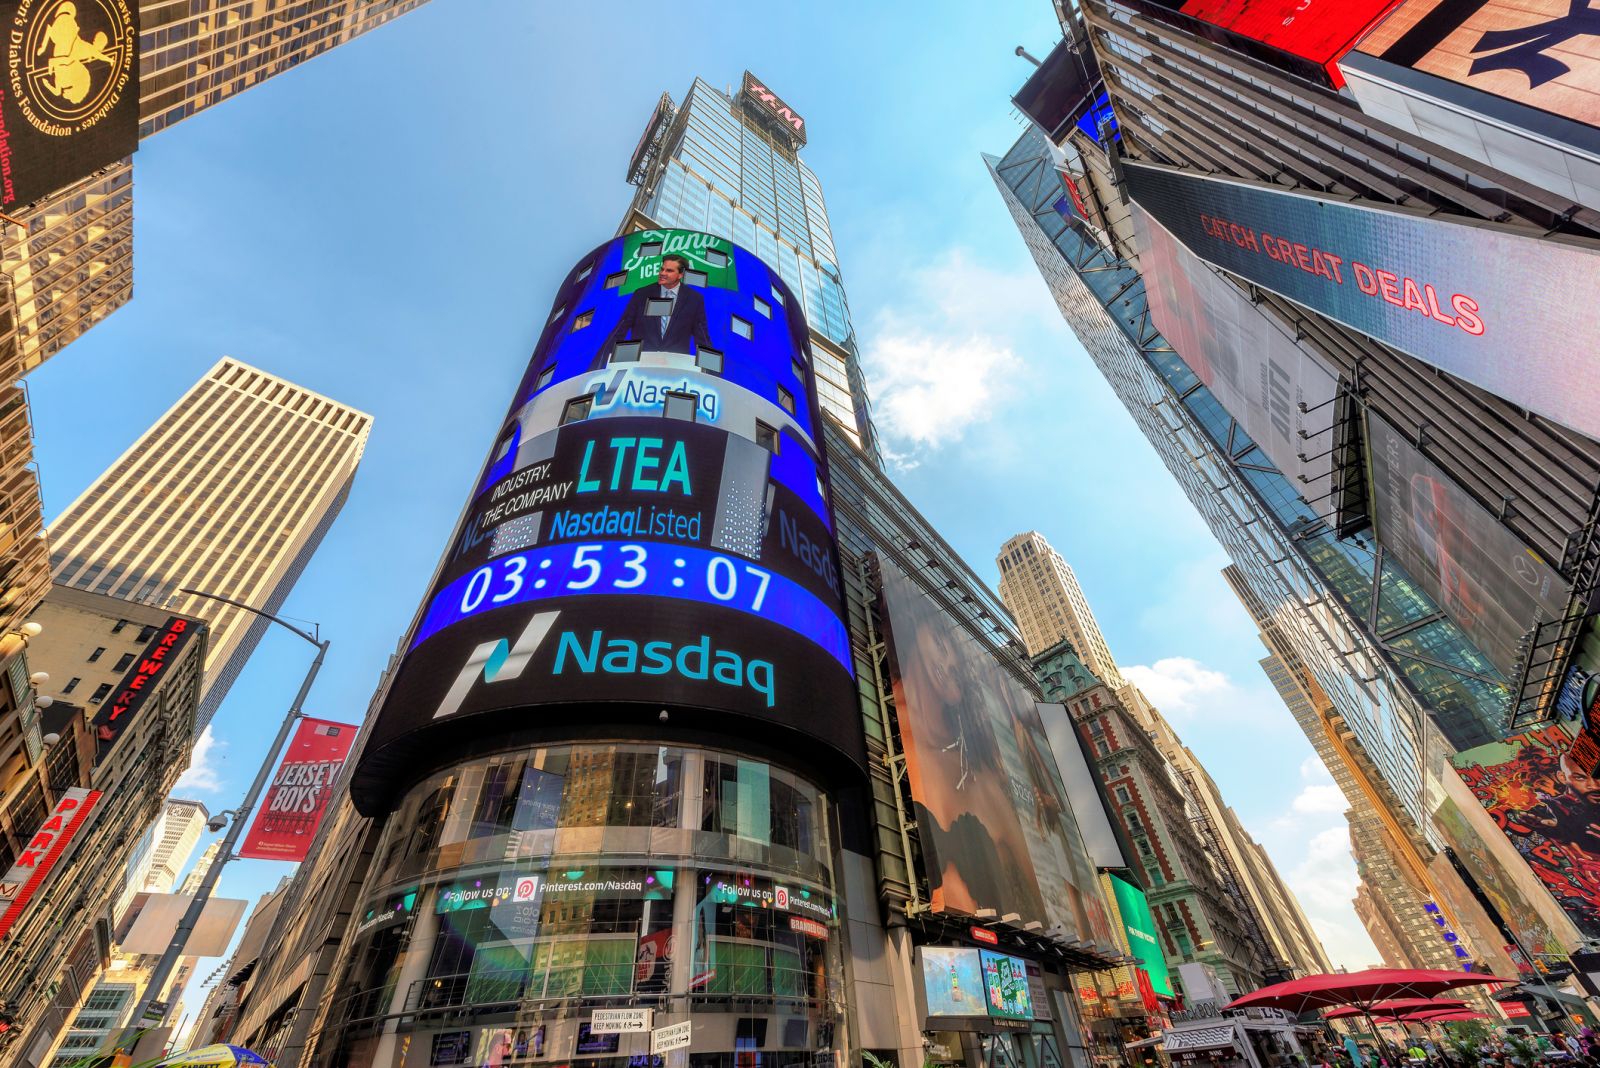
The S&P 500 Index ($SPX ) (SPY ) this morning is down -0.14%, the Dow Jones Industrials Index ($DOWI ) (DIA ) is up +0.33%, and the Nasdaq 100 Index ($IUXX ) (QQQ ) is down -0.43%. US stock indexes this...

$SPX : 4,985.38 (-0.51%)
SPY : 497.13 (-0.48%)
$DOWI : 38,029.16 (+0.67%)
DIA : 380.03 (+0.58%)
$IUXX : 17,140.32 (-1.46%)
QQQ : 417.25 (-1.45%)
ZNM24 : 107-270 (+0.13%)
UNH : 505.67 (+2.53%)
WEC : 81.78 (+1.67%)
LEN : 150.71 (-1.17%)
BLDR : 178.38 (-2.14%)
PHM : 105.60 (-0.34%)
Gold/Silver: Metals Snap-Back After Broad Based Liquidation – Metals Minute w/ Phil Streible

Tune into today’s Metals Minute for key levels and actionable trade ideas covering your favorite Precious Metals, overnight developments, and what to watch for every trading day.

Key Turning Points

3rd Resistance Point N/A
2nd Resistance Point 100.301
1st Resistance Point 100.301
Last Price 100.301s
1st Support Level 100.301
2nd Support Level 100.301
3rd Support Level N/A

See More

52-Week High 100.365
Last Price 100.301s
Fibonacci 61.8% 100.239
Fibonacci 50% 100.200
Fibonacci 38.2% 100.161
52-Week Low 100.035

See More

Want to use this as
your default charts setting?
Save this setup as a Chart Templates
Switch the Market flag
for targeted data from your country of choice.
Open the menu and switch the
Market flag for targeted data from your country of choice.
Want Streaming Chart Updates?
Switch your Site Preferences
to use Interactive Charts
Need More Chart Options?
Right-click on the chart to open the Interactive Chart menu.

Free Barchart Webinar